$40K Bitcoin price is in reach, but analysts warn that a sweep of recent lows is likely

Sky high inflation, fear over the Fed’s expected rate hike and exploding commodity prices are all possible reasons for BTC’s recent dip below $40,000.
There’s was no rest for weary crypto traders on March 10 as a blistering 7.9% CPI print emerged as the headline of the day, putting pressure on global financial markets and erasing the previous day's gains in Bitcoin (BTC) as the price fell back below $40,000.
Data from Cointelegraph Markets Pro and TradingView shows that the BTC sell-off kicked off in the early trading hours on Thursday and escalated into midday with the price hitting a low of $38,562 before dip buyers bid it back above support at $39,000.
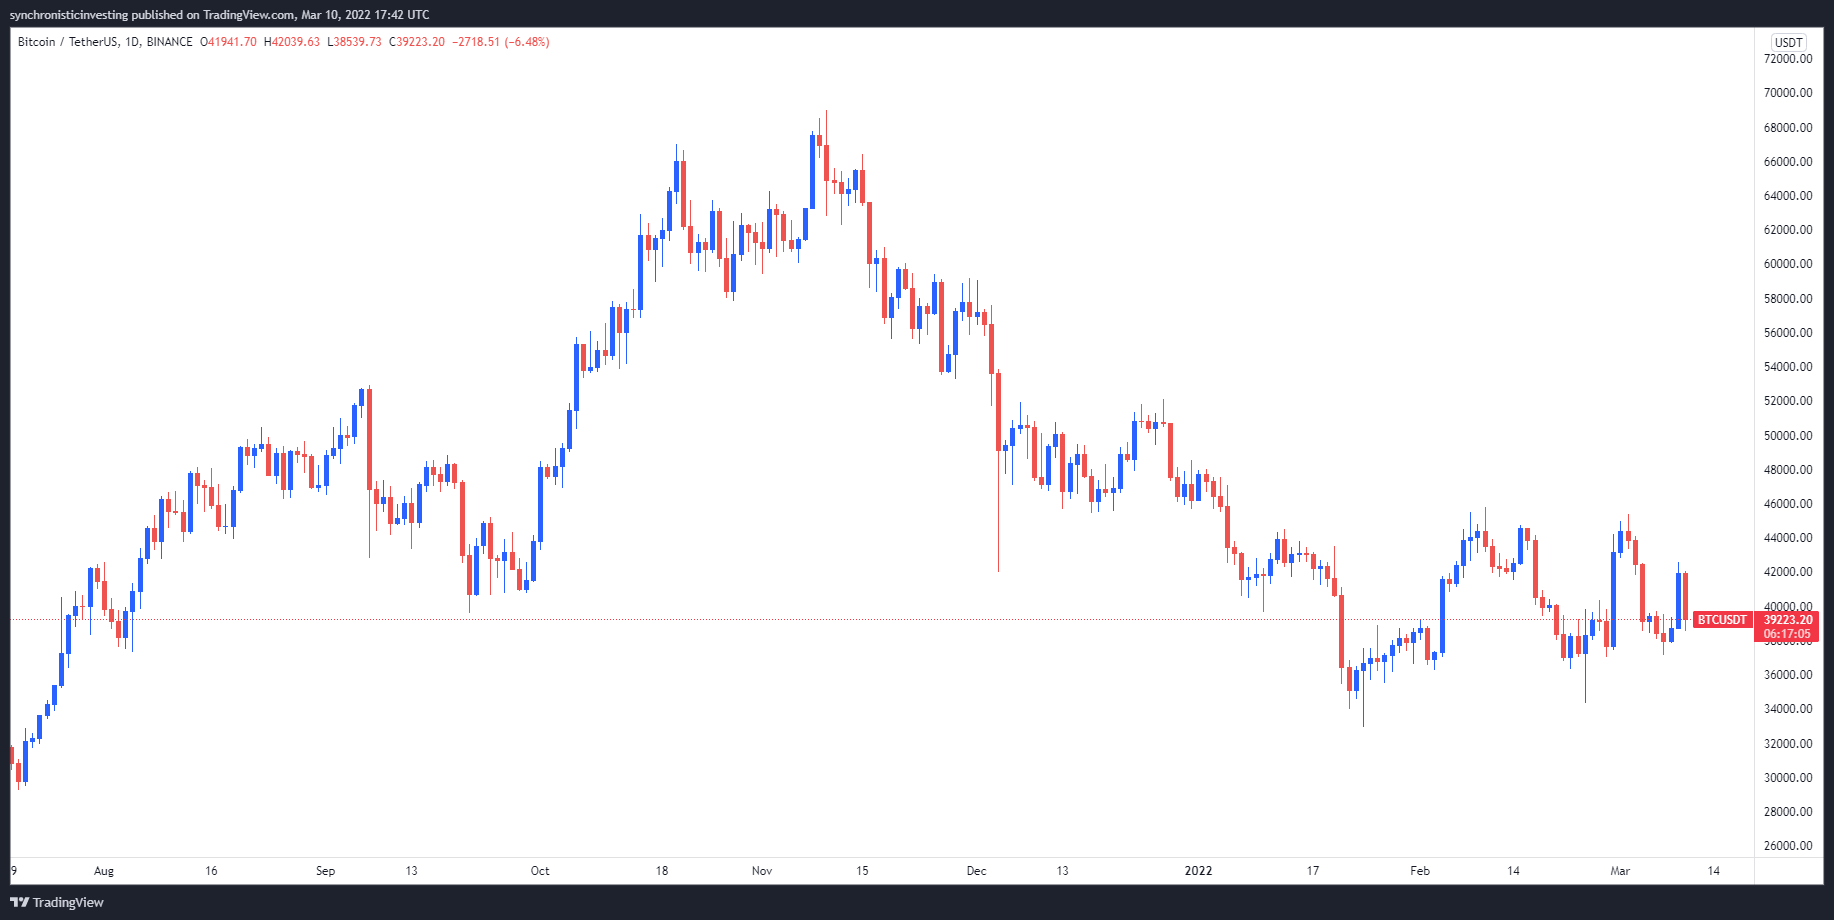
BTC/USDT 1-day chart. Source: TradingView
Here’s what analysts have to say about the ongoing see-saw price action for BTC and what levels to keep an eye on for a bullish breakout or bearish downturn.
“Price compression precedes volatility”
Insight into the recent volatility for Bitcoin was offered by crypto trader and pseudonymous Twitter user ‘Rekt Capital’, who posted the following chart noting that “BTC is still consolidating between the green higher low support and the blue 50-week EMA resistance.”
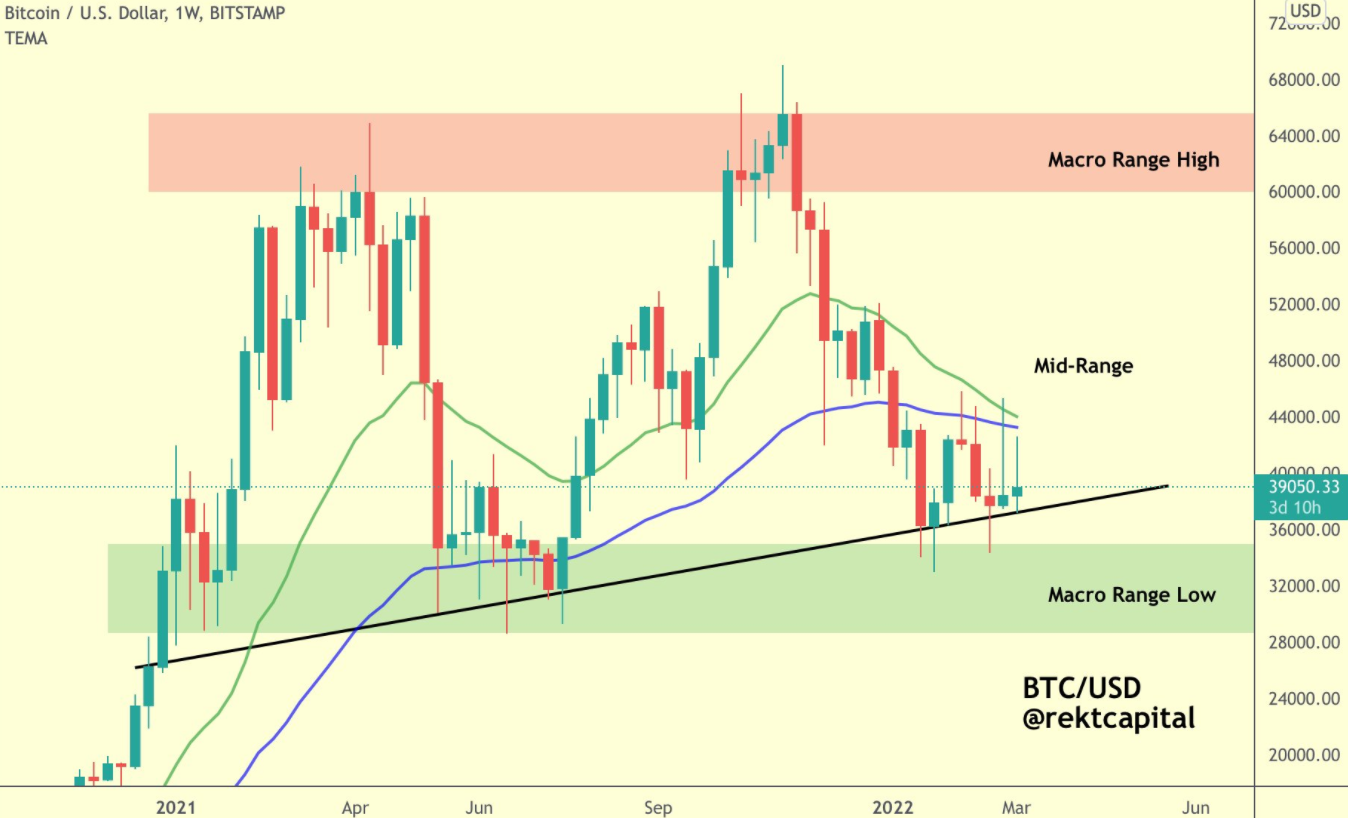
BTC/USD 1-week chart. Source: Twitter
According to Rekt Capital, “the higher lows and lower highs are compressing price. Price compression precedes volatility.”
As for what it would take to reclaim the bullish narrative, Rekt Capital pointed to the green and blue exponential moving average (EMA) lines which have proved to be strong points of resistance over the past two weeks.
Rekt Captial said,
To move higher inside its macro range, BTC needs to reclaim the two key bull market EMAs to confirm bullish momentum.
BTC holders risk selling at a loss
The oscillating nature of BTC's price action in recent weeks was discussed by research fund, Stack Funds, which noted in its current weekly report that “Bitcoin has whipsawed the past few weeks, trading within the $35,000 – $45,000 range with no strong directional momentum intact.”
According to Stack Funds, this recent price action “has been mainly news-driven” and the analysts see no relief in the near term as the conflict in Ukraine and the persistent rise of inflation continue to pose significant headwinds.
Evidence that traders have a low appetite for increasing exposure to the current market conditions can be found by looking at the Bitcoin Spent Output Profit Ratio (SOPR), a metric that indicates the aggregate gains and losses realized on a particular day.
Stack Funds noted that the long-term BTC holder SOPR “is trending towards its threshold value of 1.0,” an important level as it marks the defining line between selling at a profit or selling at a loss.
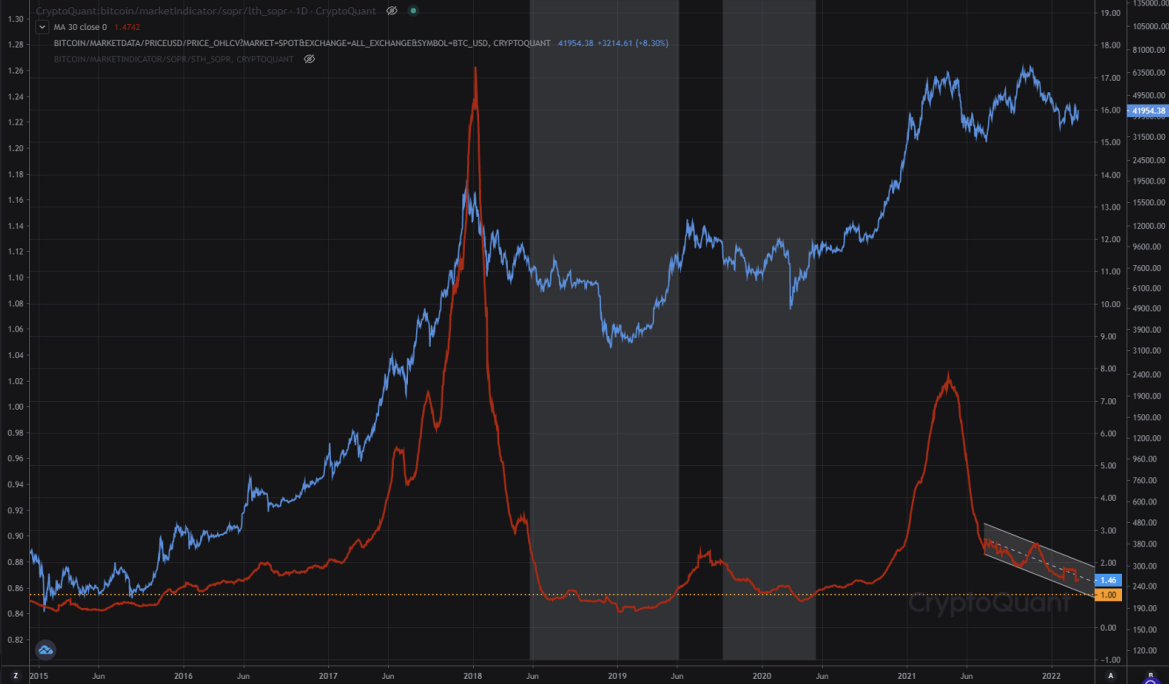
Bitcoin long-term holder SOPR. Source: Stack Funds
According to the report, the long-term holder SOPR has been trending down since Bitcoin’s price hit its peak in November 2021,” and currently it trades “around the 1.5 handle.”
During the two instances shown on the chart above where the SOPR trended and traded below the 1.0 threshold in mid-2018 and the end of 2019, “Bitcoin traded sideways and dipped further both times.”
Stack Funds said,
Unless we see some positive catalyst in the markets or a reversal in the SOPR indicator, we expect sideways trading and possibly a potential dip in price action, at least in the short term.
But it’s not all doom and gloom when it comes to Bitcoin price from an on-chain analysis point of view. In the following chart posted by crypto analyst and pseudonymous Twitter user ‘Plan C’, the analyst explains that “the number of Bitcoin accumulation addresses has gone parabolic over the last month.”
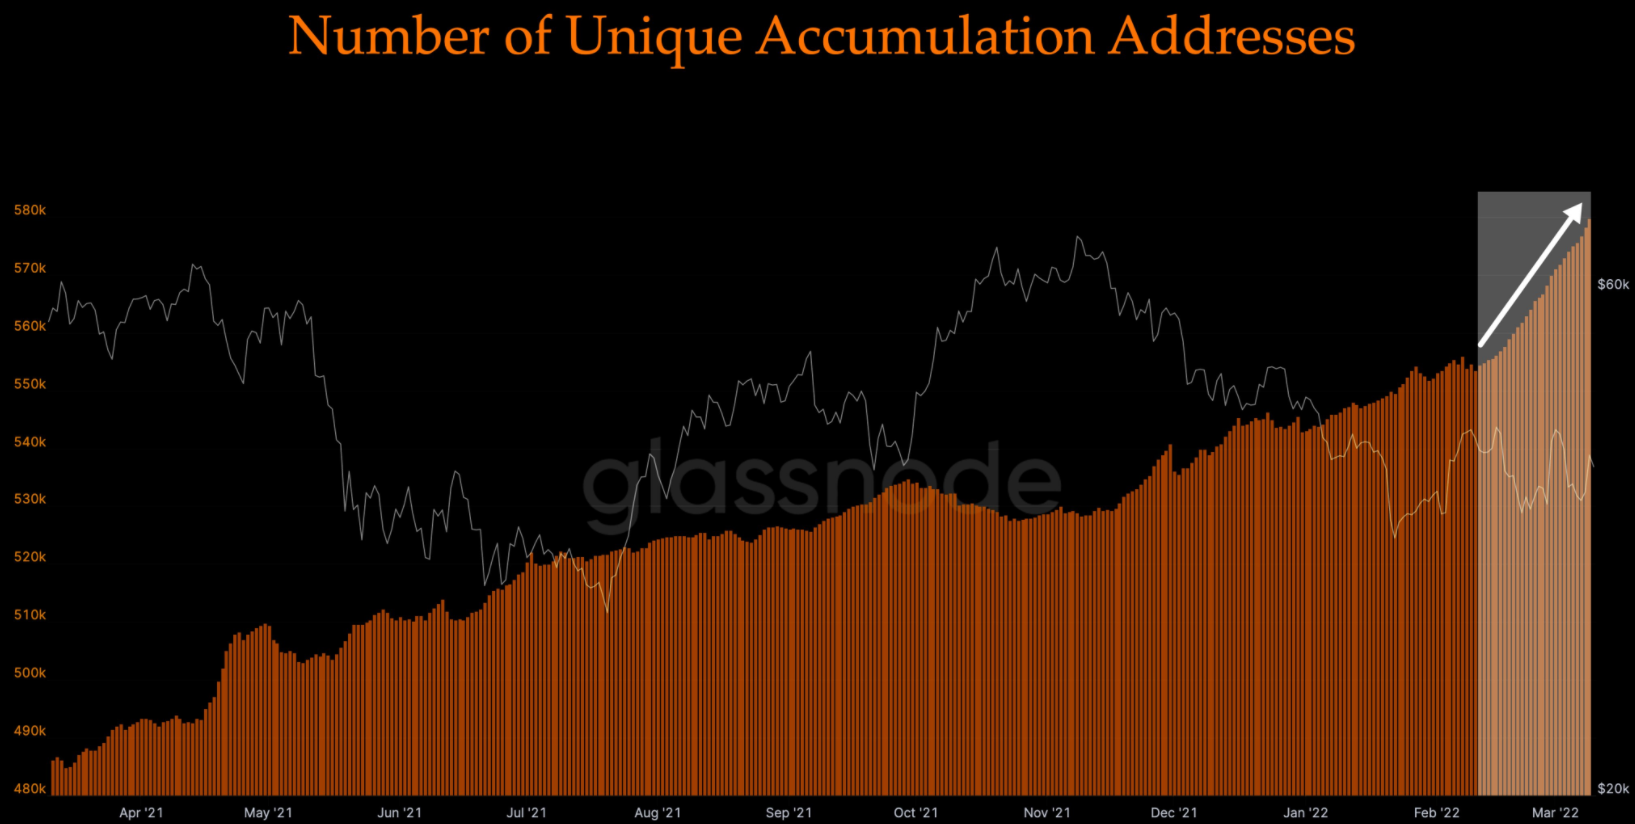
The number of unique BTC accumulation addresses. Source: Twitter
Plan C defined accumulation addresses as “addresses that have at least 2 incoming non-dust transfers and have NEVER spent funds BTC.”
Not bullish below $46,000
As for the near-term outlook for Bitcoin, market analyst and Cointelegraph contributor Michaël van de Poppe noted that things are not looking bullish below $46,000 and he thinks “the chances of taking these lows are quite significant.”
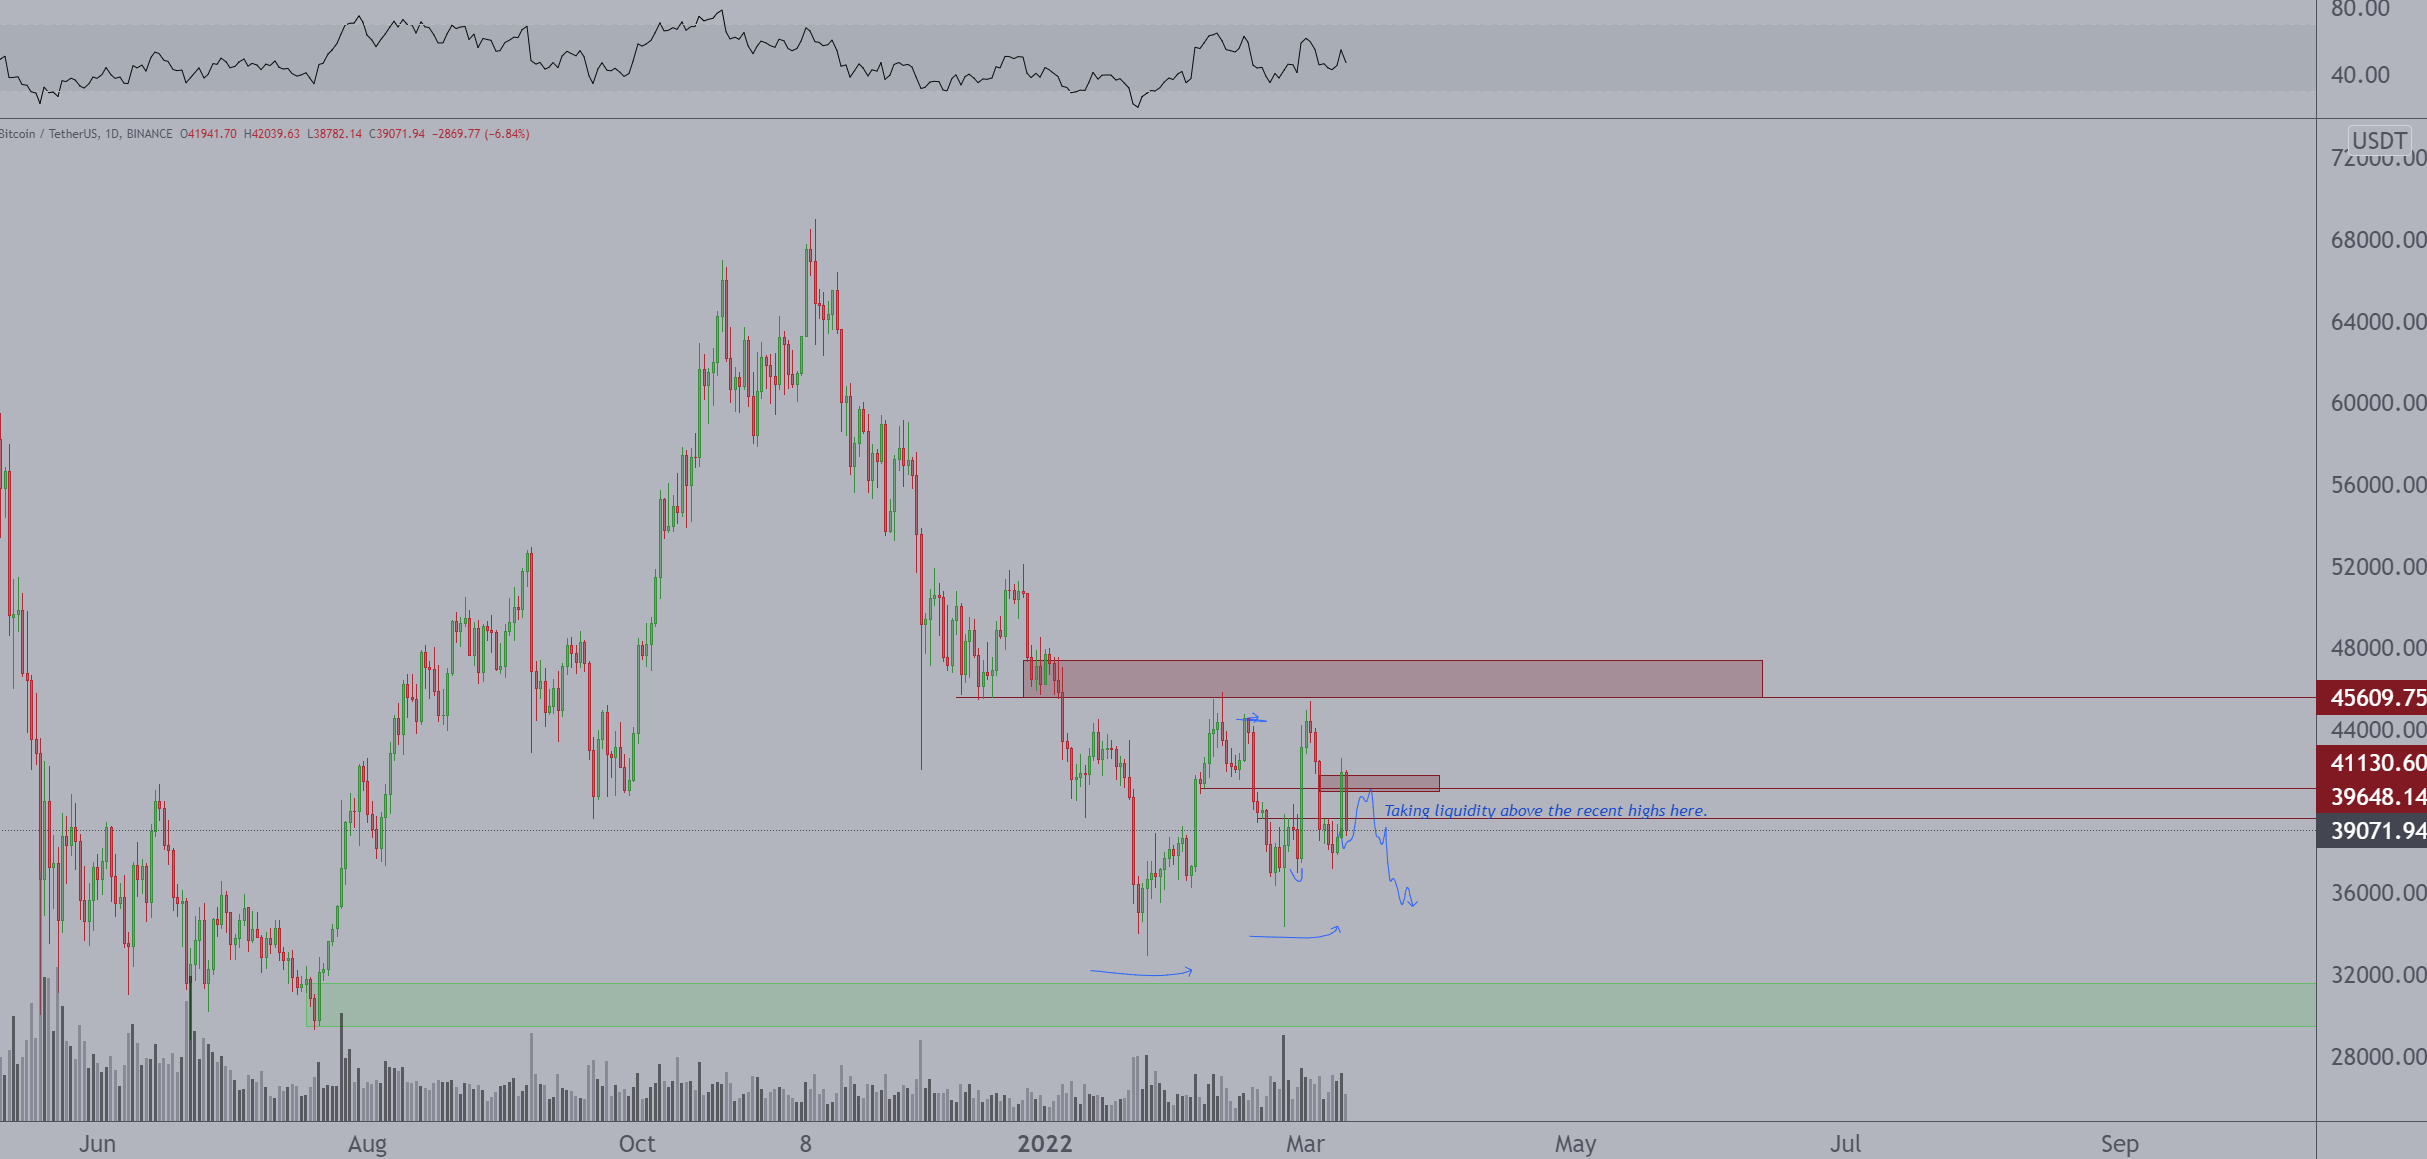
BTC/USDT 1-day chart. Source: Twitter
These short-term bearish sentiments were echoed recently by David Lifchitz, managing partner and chief investment officer at ExoAlpha, who noted that the recent spike in BTC “came out of nowhere and lasted less than one hour with not much follow-through.”
Lifchitz said,
BTC remains still stuck in the $33,000-$45,000 range. Without any follow-through in the next 48 hours and a possible break above $45,000 toward $50,000, BTC will probably keep on bouncing in the range.
The overall cryptocurrency market cap now stands at $1.744 trillion and Bitcoin’s dominance rate is 42.6%.
Author

Cointelegraph Team
Cointelegraph
We are privileged enough to work with the best and brightest in Bitcoin.


