- 1INCH price stuck in bearish formation as price action takes another leg lower early in the week.
- 1INCH is nearing the consolidation point of the bearish triangle.
- Expect to see a firm break that could tank towards $0.40 and test the low of March.
1INCH (1INCH) price is under the scrutiny of a bearish triangle as the base was identified on Monday with a small bounce off it. Although bulls could still try to go for a breakout trade, the Relative Strength Index (RSI) shows clear signs that the pattern is on its way to completing its cycle. A bearish breakdown does not need to mean issues, although traders must know how big the downward movement can be.
1INCH targets $0.40 as bearish triangle develops
1INCH price has investors and traders gearing up for another leg lower. Why stand in the way if the drop is a near certainty with the bearish pattern and the RSI both very much in sync with each other confirming the downward trajectory. When the base breaks, a broad area becomes exposed, with the low of March at risk of printing an even lower number than at the beginning of the month.
1INCH thus sees traders on the sideways, avoiding to support the price action just yet. Expect the drop to reach as far as $0.40 and bear 17% losses for the breakout. If the selloff overshoots, the monthly S2 at $0.38 is primed to fill in the gap.
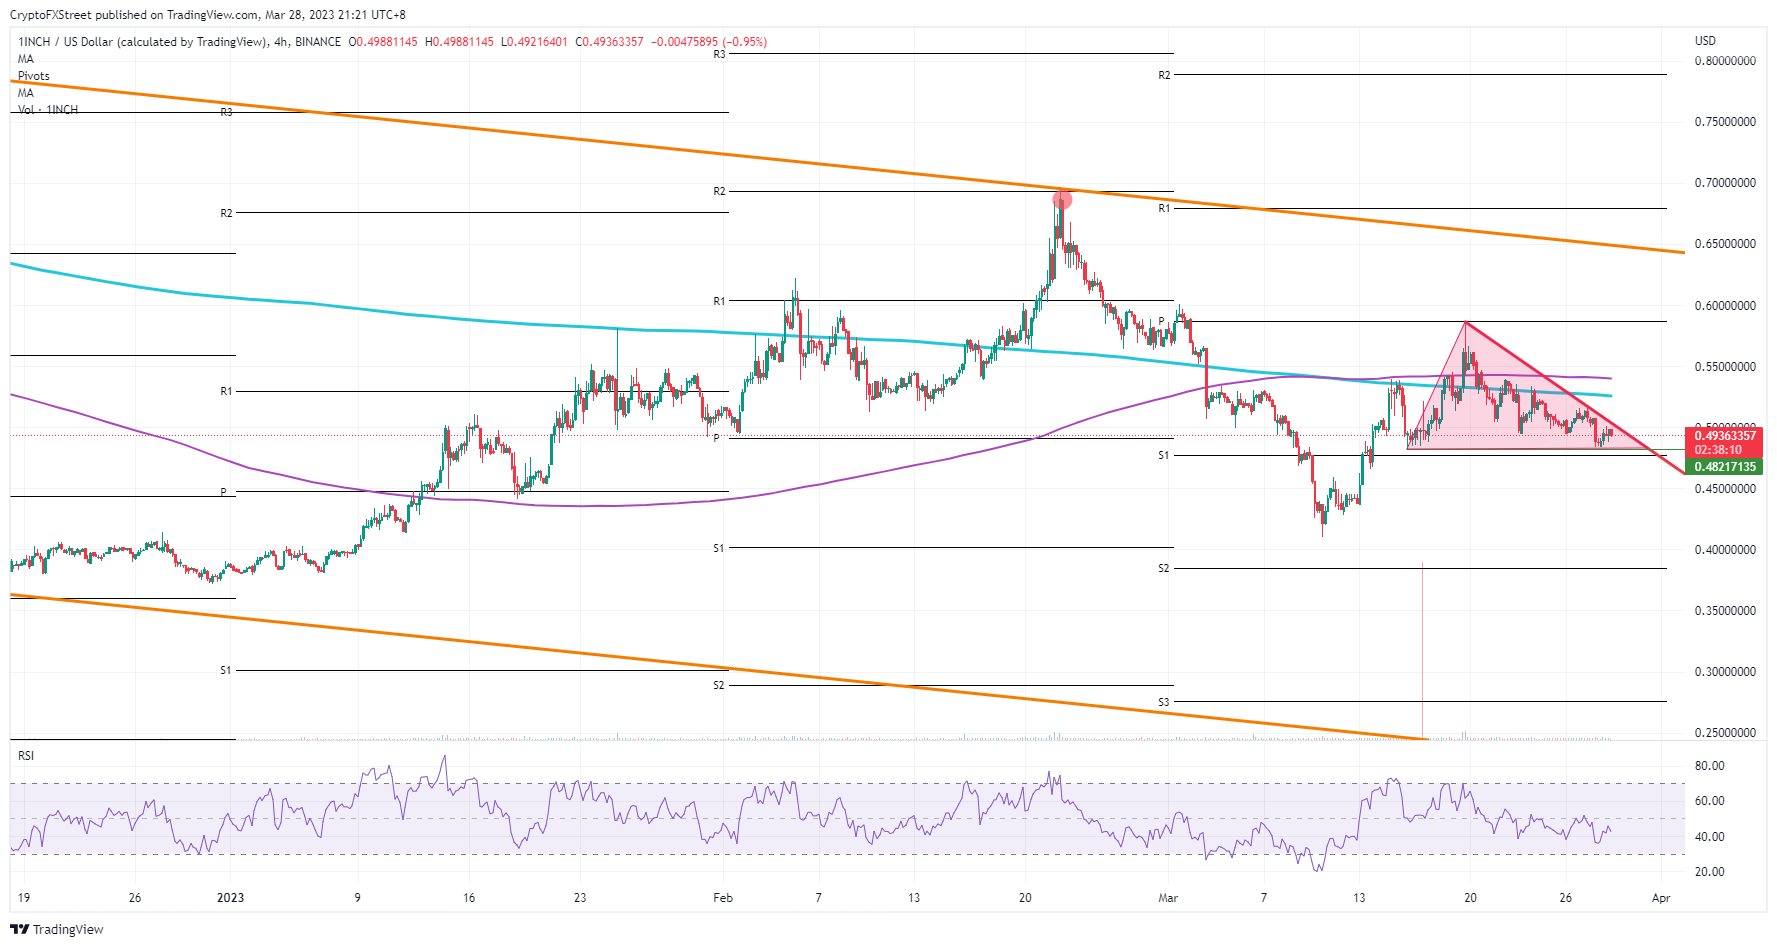
1INCH/USD 4H-chart
From a bullish angle, the ideal scenario would be a bear trap on s small breach below the monthly S1. Such development could easily be met with some heavy buying of bulls. Price action would quickly swoop up higher and pierce through the 55-day and the 200-day Simple Moving Average to hit $0.58, with an 18% increase at hand.
Information on these pages contains forward-looking statements that involve risks and uncertainties. Markets and instruments profiled on this page are for informational purposes only and should not in any way come across as a recommendation to buy or sell in these assets. You should do your own thorough research before making any investment decisions. FXStreet does not in any way guarantee that this information is free from mistakes, errors, or material misstatements. It also does not guarantee that this information is of a timely nature. Investing in Open Markets involves a great deal of risk, including the loss of all or a portion of your investment, as well as emotional distress. All risks, losses and costs associated with investing, including total loss of principal, are your responsibility. The views and opinions expressed in this article are those of the authors and do not necessarily reflect the official policy or position of FXStreet nor its advertisers. The author will not be held responsible for information that is found at the end of links posted on this page.
If not otherwise explicitly mentioned in the body of the article, at the time of writing, the author has no position in any stock mentioned in this article and no business relationship with any company mentioned. The author has not received compensation for writing this article, other than from FXStreet.
FXStreet and the author do not provide personalized recommendations. The author makes no representations as to the accuracy, completeness, or suitability of this information. FXStreet and the author will not be liable for any errors, omissions or any losses, injuries or damages arising from this information and its display or use. Errors and omissions excepted.
The author and FXStreet are not registered investment advisors and nothing in this article is intended to be investment advice.
Recommended Content
Editors’ Picks

Bitcoin Weekly Forecast: BTC nosedives below $95,000 as spot ETFs record highest daily outflow since launch
Bitcoin price continues to edge down, trading below $95,000 on Friday after declining more than 9% this week. Bitcoin US spot ETFs recorded the highest single-day outflow on Thursday since their launch in January.

Bitcoin crashes to $96,000, altcoins bleed: Top trades for sidelined buyers
Bitcoin (BTC) slipped under the $100,000 milestone and touched the $96,000 level briefly on Friday, a sharp decline that has also hit hard prices of other altcoins and particularly meme coins.

Solana Price Forecast: SOL’s technical outlook and on-chain metrics hint at a double-digit correction
Solana (SOL) price trades in red below $194 on Friday after declining more than 13% this week. The recent downturn has led to $38 million in total liquidations, with over $33 million coming from long positions.

SEC approves Hashdex and Franklin Templeton's combined Bitcoin and Ethereum crypto index ETFs
The SEC approved Hashdex's proposal for a crypto index ETF. The ETF currently features Bitcoin and Ethereum, with possible additions in the future. The agency also approved Franklin Templeton's amendment to its Cboe BZX for a crypto index ETF.

Bitcoin: 2025 outlook brightens on expectations of US pro-crypto policy
Bitcoin (BTC) price has surged more than 140% in 2024, reaching the $100K milestone in early December. The rally was driven by the launch of Bitcoin Spot Exchange Traded Funds (ETFs) in January and the reduced supply following the fourth halving event in April.

Best Forex Brokers with Low Spreads
VERIFIED Low spreads are crucial for reducing trading costs. Explore top Forex brokers offering competitive spreads and high leverage. Compare options for EUR/USD, GBP/USD, USD/JPY, and Gold.