- 1INCH price eyes a retest of the $0.443 to $0.471 support zone.
- Increasing Open Interest and a plummet in supply on exchanges indicate investors' are accumulating.
- 1INCH could rally 20% to $0.560.
- A daily candlestick close below $0.327 would invalidate the bullish thesis.
1INCH (1INCH) price falls on Friday, and it is likely to face a further pullback after rallying 15% since Tuesday. However, a price decline towards $0.471-$0.443 could provide an opportunity for sidelined buyers as on-chain metrics and open interest data suggest that this area is a major support zone from which prices could rally by 20%.
1INCH price rally is fueled by rising Open Interest
Data from CoinGlass shows the Future's Open interest of 1INCH at exchanges is increasing. The Open Interest indicates the total number of outstanding derivative contracts that have not been settled (offset by delivery) and whether money flows into the contract are increasing or decreasing.
Increasing Open Interest represents new or additional money coming into the market and new buying happening, which is a bullish trend. When Open Interest decreases, it is usually a sign that the market is liquidating, more investors are leaving, and the current price trend is ending.
As shown in the graph, the Open Interest of 1INCH increased from $17.54 million on May 24 to 32.53 million on May 30, indicating that new or additional money is coming into the market and new buying is happening. A similar trend was seen in the bullish price movement from February 26 to March 16.
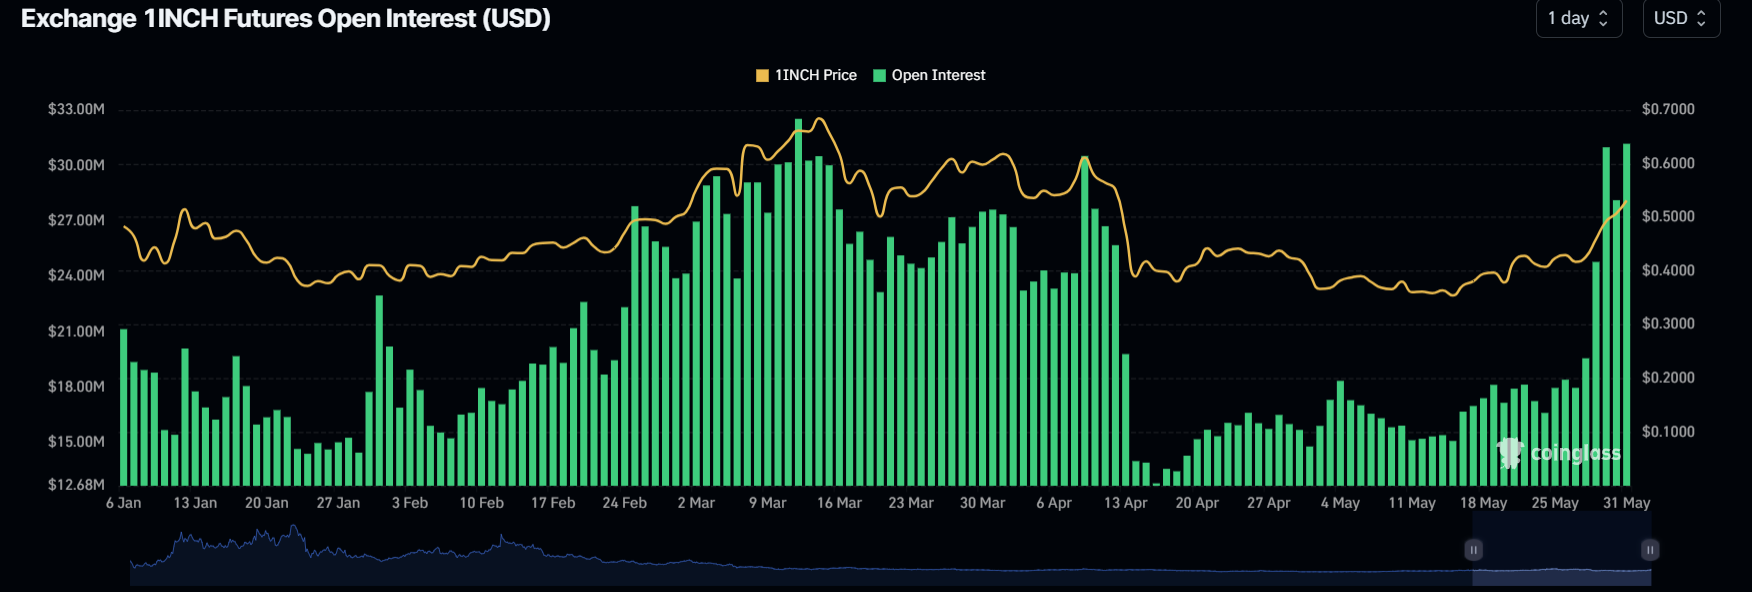
1INCH 1-day Open Interest chart
1INCH price shows promise for a potential rally
1INCH price broke the resistance level at $0.443 on Tuesday and has rallied 17% since then.Due to this sharp move to the upside, 1INCH bulls could take a break, leading to a retracement.
Investors looking for buying opportunities can do so at the support zone between $0.471 and $0.443, which coincides with the 200-day Exponential Moving Average (EMA) at $0.439.
Assuming 1INCH price bounces off the $0.471 level, it could rally 20% to the 61.8% Fibonacci retracement level (plotted from the March 13 high of 0.704 to the April 13 low of 0.327) at $0.560.
The Relative Strength Index (RSI) and Awesome Oscillator (AO) indicators support the aforementioned bounce, which are firmly present above their respective mean values of 50 and 0. The momentum indicators signal that bulls are in control.
If the bullish outlook persists above $0.560,1INCH could extend the rally by 25% to retest the 100% Fibonacci retracement level at $0.704.
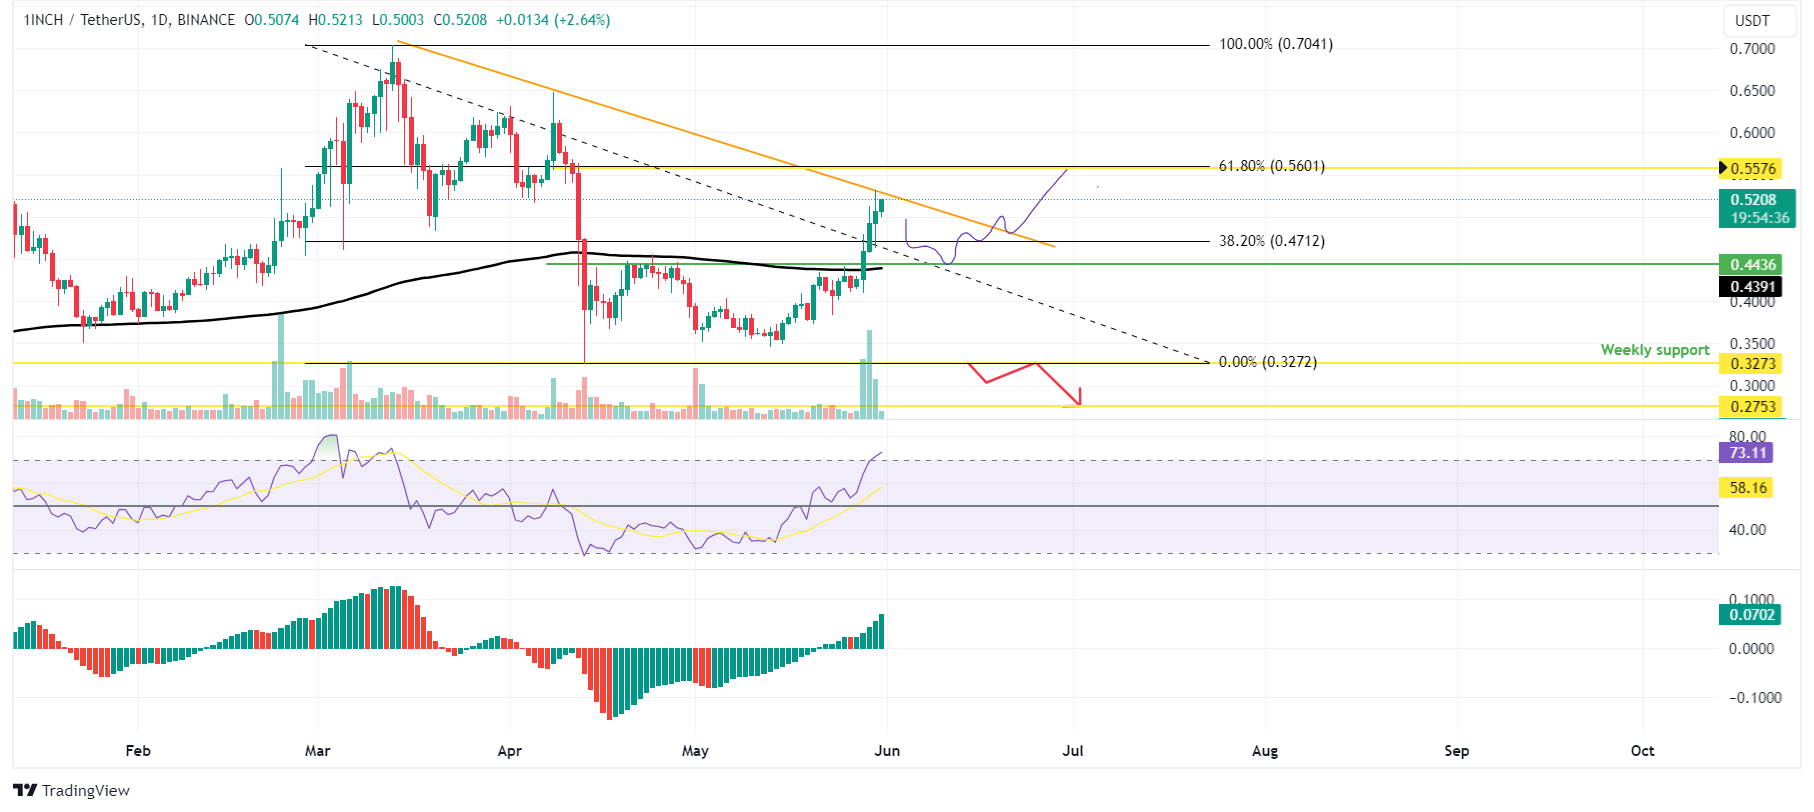
1INCH/USDT 1-day chart
Santiment’s Supply on Exchanges index shows 1INCH tokens available on centralized platforms plummeted from roughly $117 million to $94 million from May 28 to 30. This 19% drop in tokens held on exchanges indicates that the investors are confident in 1INCH price performance and are not looking to sell.
%20[09.41.33,%2031%20May,%202024]-638527394277953618.png)
1INCH Supply of Exchanges chart
Despite strong technical analysis and on-chain data, if the daily candlestick closes below the weekly support at $0.327, then 1INCH price will form a lower low in the higher time frame, indicating a bearish market structure. Thus, the bullish thesis would be invalidated, triggering a potential crash to $0.275, roughly 16% away from $0.327.
Information on these pages contains forward-looking statements that involve risks and uncertainties. Markets and instruments profiled on this page are for informational purposes only and should not in any way come across as a recommendation to buy or sell in these assets. You should do your own thorough research before making any investment decisions. FXStreet does not in any way guarantee that this information is free from mistakes, errors, or material misstatements. It also does not guarantee that this information is of a timely nature. Investing in Open Markets involves a great deal of risk, including the loss of all or a portion of your investment, as well as emotional distress. All risks, losses and costs associated with investing, including total loss of principal, are your responsibility. The views and opinions expressed in this article are those of the authors and do not necessarily reflect the official policy or position of FXStreet nor its advertisers. The author will not be held responsible for information that is found at the end of links posted on this page.
If not otherwise explicitly mentioned in the body of the article, at the time of writing, the author has no position in any stock mentioned in this article and no business relationship with any company mentioned. The author has not received compensation for writing this article, other than from FXStreet.
FXStreet and the author do not provide personalized recommendations. The author makes no representations as to the accuracy, completeness, or suitability of this information. FXStreet and the author will not be liable for any errors, omissions or any losses, injuries or damages arising from this information and its display or use. Errors and omissions excepted.
The author and FXStreet are not registered investment advisors and nothing in this article is intended to be investment advice.
Recommended Content
Editors’ Picks

Shiba Inu eyes positive returns in April as SHIB price inches towards $0.000015
Shiba Inu's on-chain metrics reveal robust adoption, as addresses with balances surge to 1.4 million. Shiba Inu's returns stand at a solid 14.4% so far in April, poised to snap a three-month bearish trend from earlier this year.

AI tokens TAO, FET, AI16Z surge despite NVIDIA excluding crypto-related projects from its Inception program
AI tokens, including Bittensor and Artificial Superintelligence Alliance, climbed this week, with ai16z still extending gains at the time of writing on Friday. The uptick in prices of AI tokens reflects a broader bullish sentiment across the cryptocurrency market.

Bitcoin Weekly Forecast: BTC consolidates after posting over 10% weekly surge
Bitcoin price is consolidating around $94,000 at the time of writing on Friday, holding onto the recent 10% increase seen earlier this week. This week’s rally was supported by strong institutional demand, as US spot ETFs recorded a total inflow of $2.68 billion until Thursday.

XRP price could renew 25% breakout bid on surging institutional and retail adoption
Ripple price consolidates, trading at $2.18 at the time of writing on Friday, following mid-week gains to $2.30. The rejection from this weekly high led to the price of XRP dropping to the previous day’s low at $2.11, followed by a minor reversal.
Bitcoin Weekly Forecast: BTC consolidates after posting over 10% weekly surge
Bitcoin (BTC) price is consolidating around $94,000 at the time of writing on Friday, holding onto the recent 10% increase seen earlier this week.

The Best brokers to trade EUR/USD
SPONSORED Discover the top brokers for trading EUR/USD in 2025. Our list features brokers with competitive spreads, fast execution, and powerful platforms. Whether you're a beginner or an expert, find the right partner to navigate the dynamic Forex market.