|

XAU/USD Elliott Wave technical analysis [Video]

Gold Elliott Wave technical analysis

Function - Counter-Trend.

Mode - Corrective.

Structure - Triangle for wave 4.

Position - Wave 4.

Direction - Wave 4 is still in play.

Details - Gold completes a triangle for wave 4. Thus, the commodity favors the upside in wave 5 if it escapes the trappings of the congestion. Invalidation remains at 2287.34.

Gold has been sideways for over 11 weeks after retracing the bullish trend that started in October 2023. Meanwhile, the commodity is expected to break to the upside to continue the trend. 

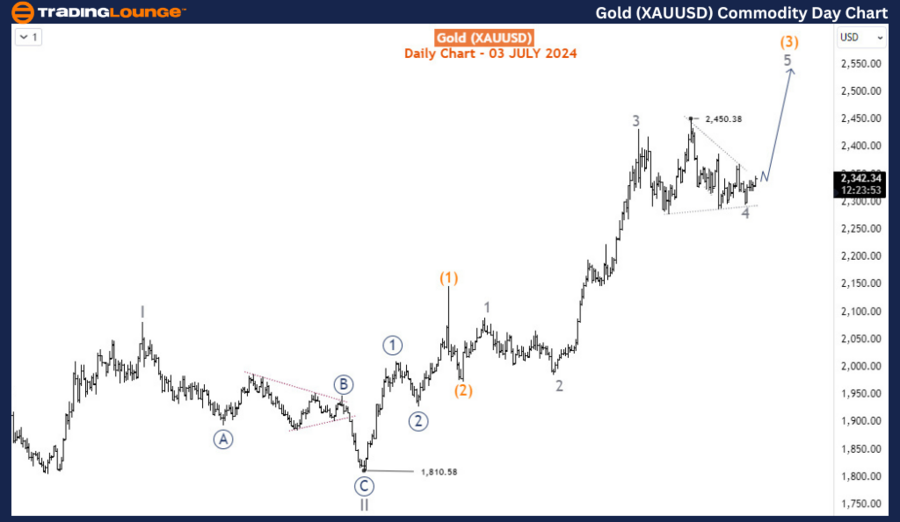
On the daily chart, a bullish impulse wave pattern emerged from September 2022 where the supercycle wave (IV) ended at 1616.9, From there, the supercycle wave (V) began. Wave I of (V) ended in May 2023 at 2081.8  before pulling back in wave II of (V) which ended at 1810.58 in October 2023. From October 2023 at 1810, wave III of (V) began and has since seen the commodity to fresh highs multiple times in the year 2024. Price is currently in wave 4 of (3) of III of (V) which has not completed a triangle pattern typical of 4th waves. Wave 5 of (3) is now expected to emerge upside toward 2576-2749.

Gold

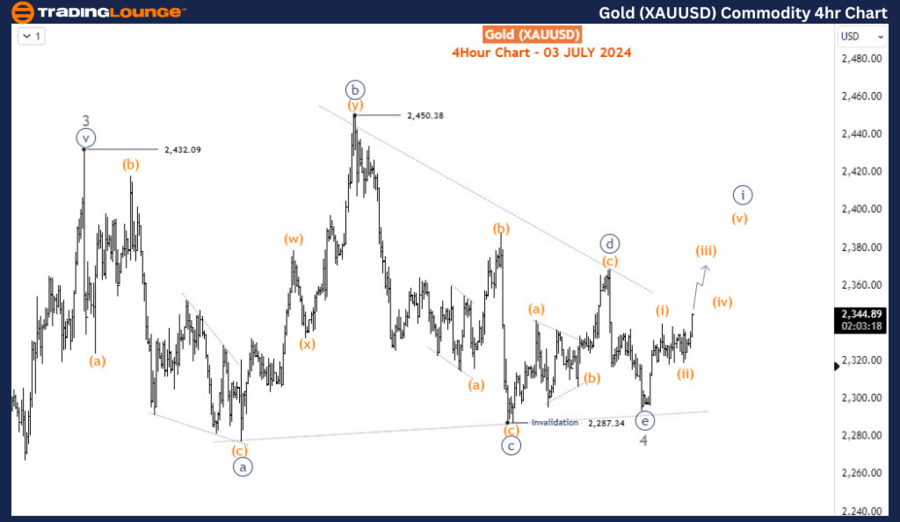
On the H4 chart, the sub-waves of wave 4 are in a triangle sideways structure. Alternatively, it could be a double zigzag if the price breaches the triangle invalidation level at 2287.34. However, if the price remains above the invalidation level and breaks outside of the triangle, then we can expect the sub-waves of wave 5 to emerge into either an impulse wave or an ending diagonal pattern.

XAUUSD

XAU/USD Elliott Wave technical analysis [Video]

Author

Peter Mathers

Peter Mathers

TradingLounge

Peter Mathers started actively trading in 1982. He began his career at Hoei and Shoin, a Japanese futures trading company.

More from Peter Mathers
Share:

Editor's Picks

EUR/USD hits two-day highs near 1.1820

EUR/USD picks up pace and reaches two-day tops around 1.1820 at the end of the week. The pair’s move higher comes on the back of renewed weakness in the US Dollar amid growing talk that the Fed could deliver an interest rate cut as early as March. On the docket, the flash US Consumer Sentiment improves to 57.3 in February.

GBP/USD reclaims 1.3600 and above

GBP/USD reverses two straight days of losses, surpassing the key 1.3600 yardstick on Friday. Cable’s rebound comes as the Greenback slips away from two-week highs in response to some profit-taking mood and speculation of Fed rate cuts. In addition, hawkish comments from the BoE’s Pill are also collaborating with the quid’s improvement.

Gold climbs further, focus is back to 45,000

Gold regains upside traction and surpasses the $4,900 mark per troy ounce at the end of the week, shifting its attention to the critical $5,000 region. The move reflects a shift in risk sentiment, driving flows back towards traditional safe haven assets and supporting the yellow metal.

Crypto Today: Bitcoin, Ethereum, XRP rebound amid risk-off, $2.6 billion liquidation wave

Bitcoin edges up above $65,000 at the time of writing on Friday, as dust from the recent macro-triggered sell-off settles. The leading altcoin, Ethereum, hovers above $1,900, but resistance at $2,000 caps the upside. Meanwhile, Ripple has recorded the largest intraday jump among the three assets, up over 10% to $1.35.

Three scenarios for Japanese Yen ahead of snap election

The latest polls point to a dominant win for the ruling bloc at the upcoming Japanese snap election. The larger Sanae Takaichi’s mandate, the more investors fear faster implementation of tax cuts and spending plans. 

XRP rally extends as modest ETF inflows support recovery

Ripple is accelerating its recovery, trading above $1.36 at the time of writing on Friday, as investors adjust their positions following a turbulent week in the broader crypto market. The remittance token is up over 21% from its intraday low of $1.12.