XAU/USD Elliott Wave technical analysis

Gold Elliott Wave analysis - Is it heading toward 2,200?
Function - Counter-trend.
Mode - Corrective.
Structure - Zigzag.
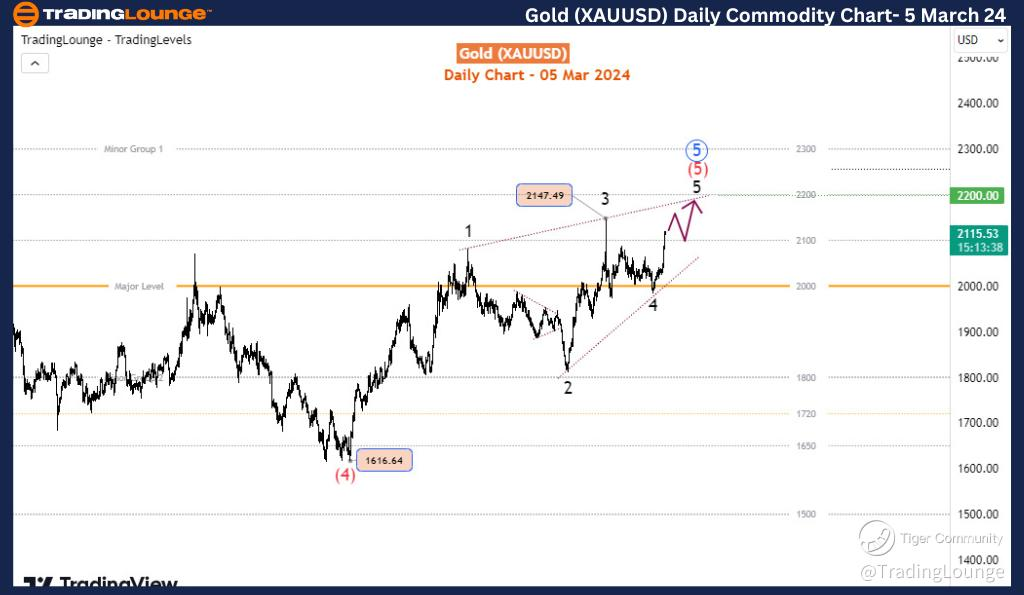
Position - Wave 5 of (5).
Direction - Upwards for Wave 5 of (5).
Gold has exhibited a bullish trend in the current week, surpassing the crucial level of 2100 and inching closer to achieving a new all-time high. By examining the daily chart, we can discern the formation of a promising bullish pattern. The fourth wave denoted as wave (4) in red, concluded at 1616 in October 2022. Subsequently, a bullish diagonal pattern has been unfolding as part of the fifth wave, known as wave (5), which belongs to a higher degree wave 5 in blue. The recent rapid surge in price can be attributed to wave 4 of (5) finding support at the significant level of 2000. As a result, wave 5 of (5) is currently progressing rapidly, and it is highly anticipated to follow a three-wave structure towards the next noteworthy level at 2200, easily surpassing the 2100 threshold.
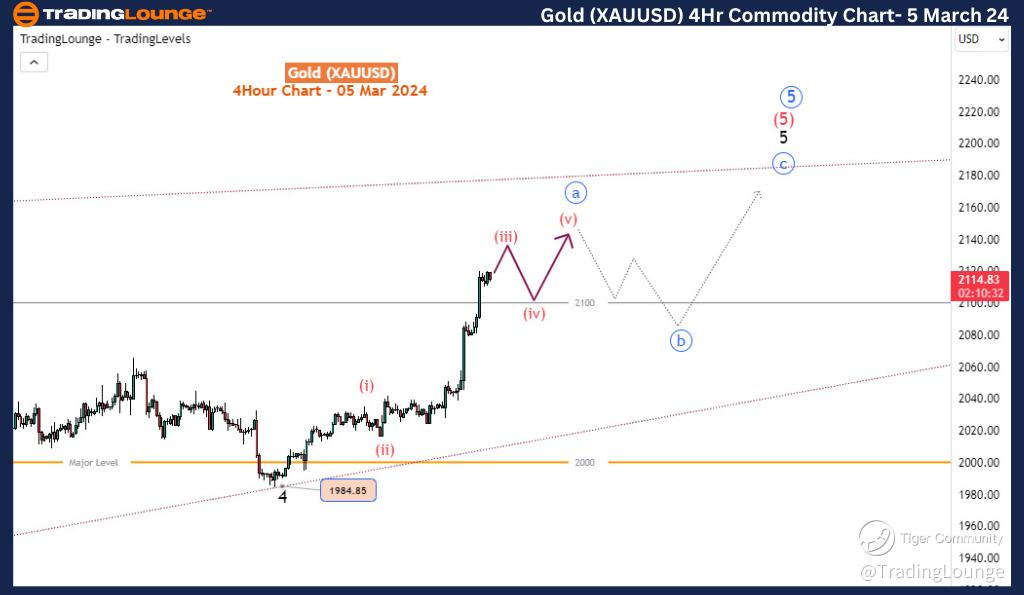
Transitioning to the H4 time frame, our analysis predicts a three-wave subdivision, identified as blue wave a-b-c, for wave 5. Considering the impulsive nature of the upward movement from $1984, we believe that it will ultimately complete the first wave, namely blue wave a. At present, blue wave a is in the process of concluding its third sub-wave, (iii) of a. Subsequently, sub-wave (iv) may retest the key level of 2100 before sub-wave (v) ultimately concludes blue wave a.
In summary, based on our analysis, the recommended strategy for traders is to consider buying the dip in Gold at this time. Traders have the option to either trade the conclusion of wave (iv) for (v) of blue wave a on the lower time frame or await the completion of blue wave b at significantly lower prices. Following this, blue wave c of 5 would be expected to propel Gold towards the 2200 mark. This analysis presents potential opportunities for traders to explore strategic entry points and benefit from the bullish momentum of Gold.
Gold daily chart
Gold four hour chart
Author

Peter Mathers
TradingLounge
Peter Mathers started actively trading in 1982. He began his career at Hoei and Shoin, a Japanese futures trading company.


