XAU/USD closing in on AB=CD resistance as the USD tests support

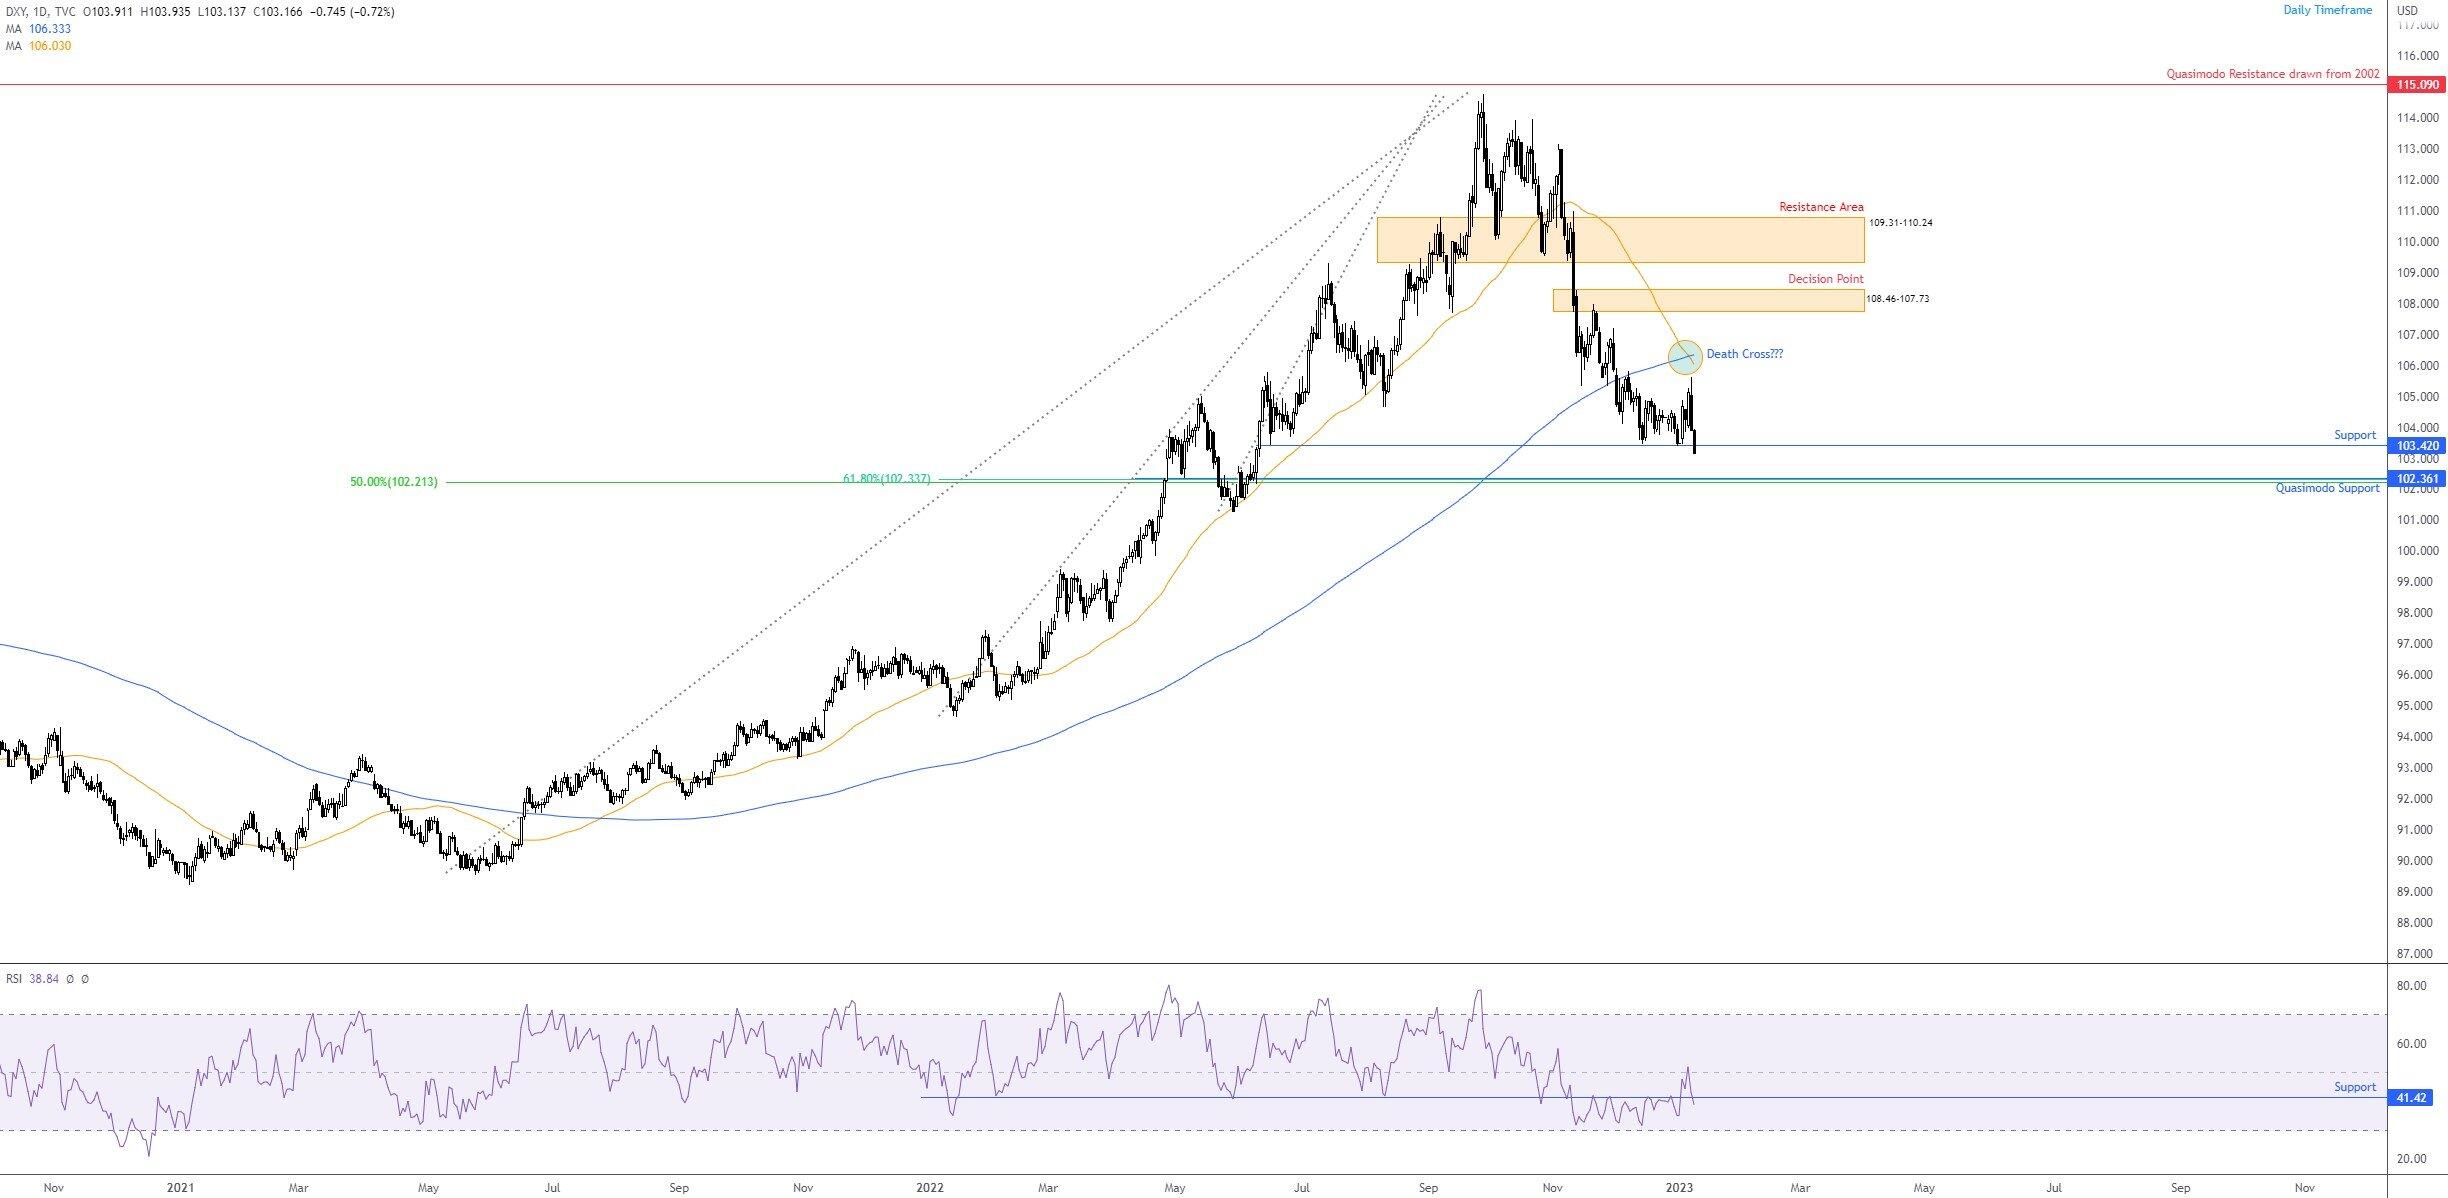
US Dollar Index at support
The research team covered the US Dollar Index in detail in the recent Weekly Market Briefing. Key observations were a possible bullish response from either daily support at 103.42 or at daily Quasimodo support from 102.36 (joined by a 61.8% Fibonacci retracement ratio at 102.34 and a 50.0% retracement from 102.21).
As evident from today’s market action, the US dollar, once again, is on the ropes and on the verge of clearing 103.42 support. A break, of course, is likely to open the door to the aforementioned daily Quasimodo formation at 102.36. Essentially, though, between the noted support levels offers traders an AREA of support to work with.
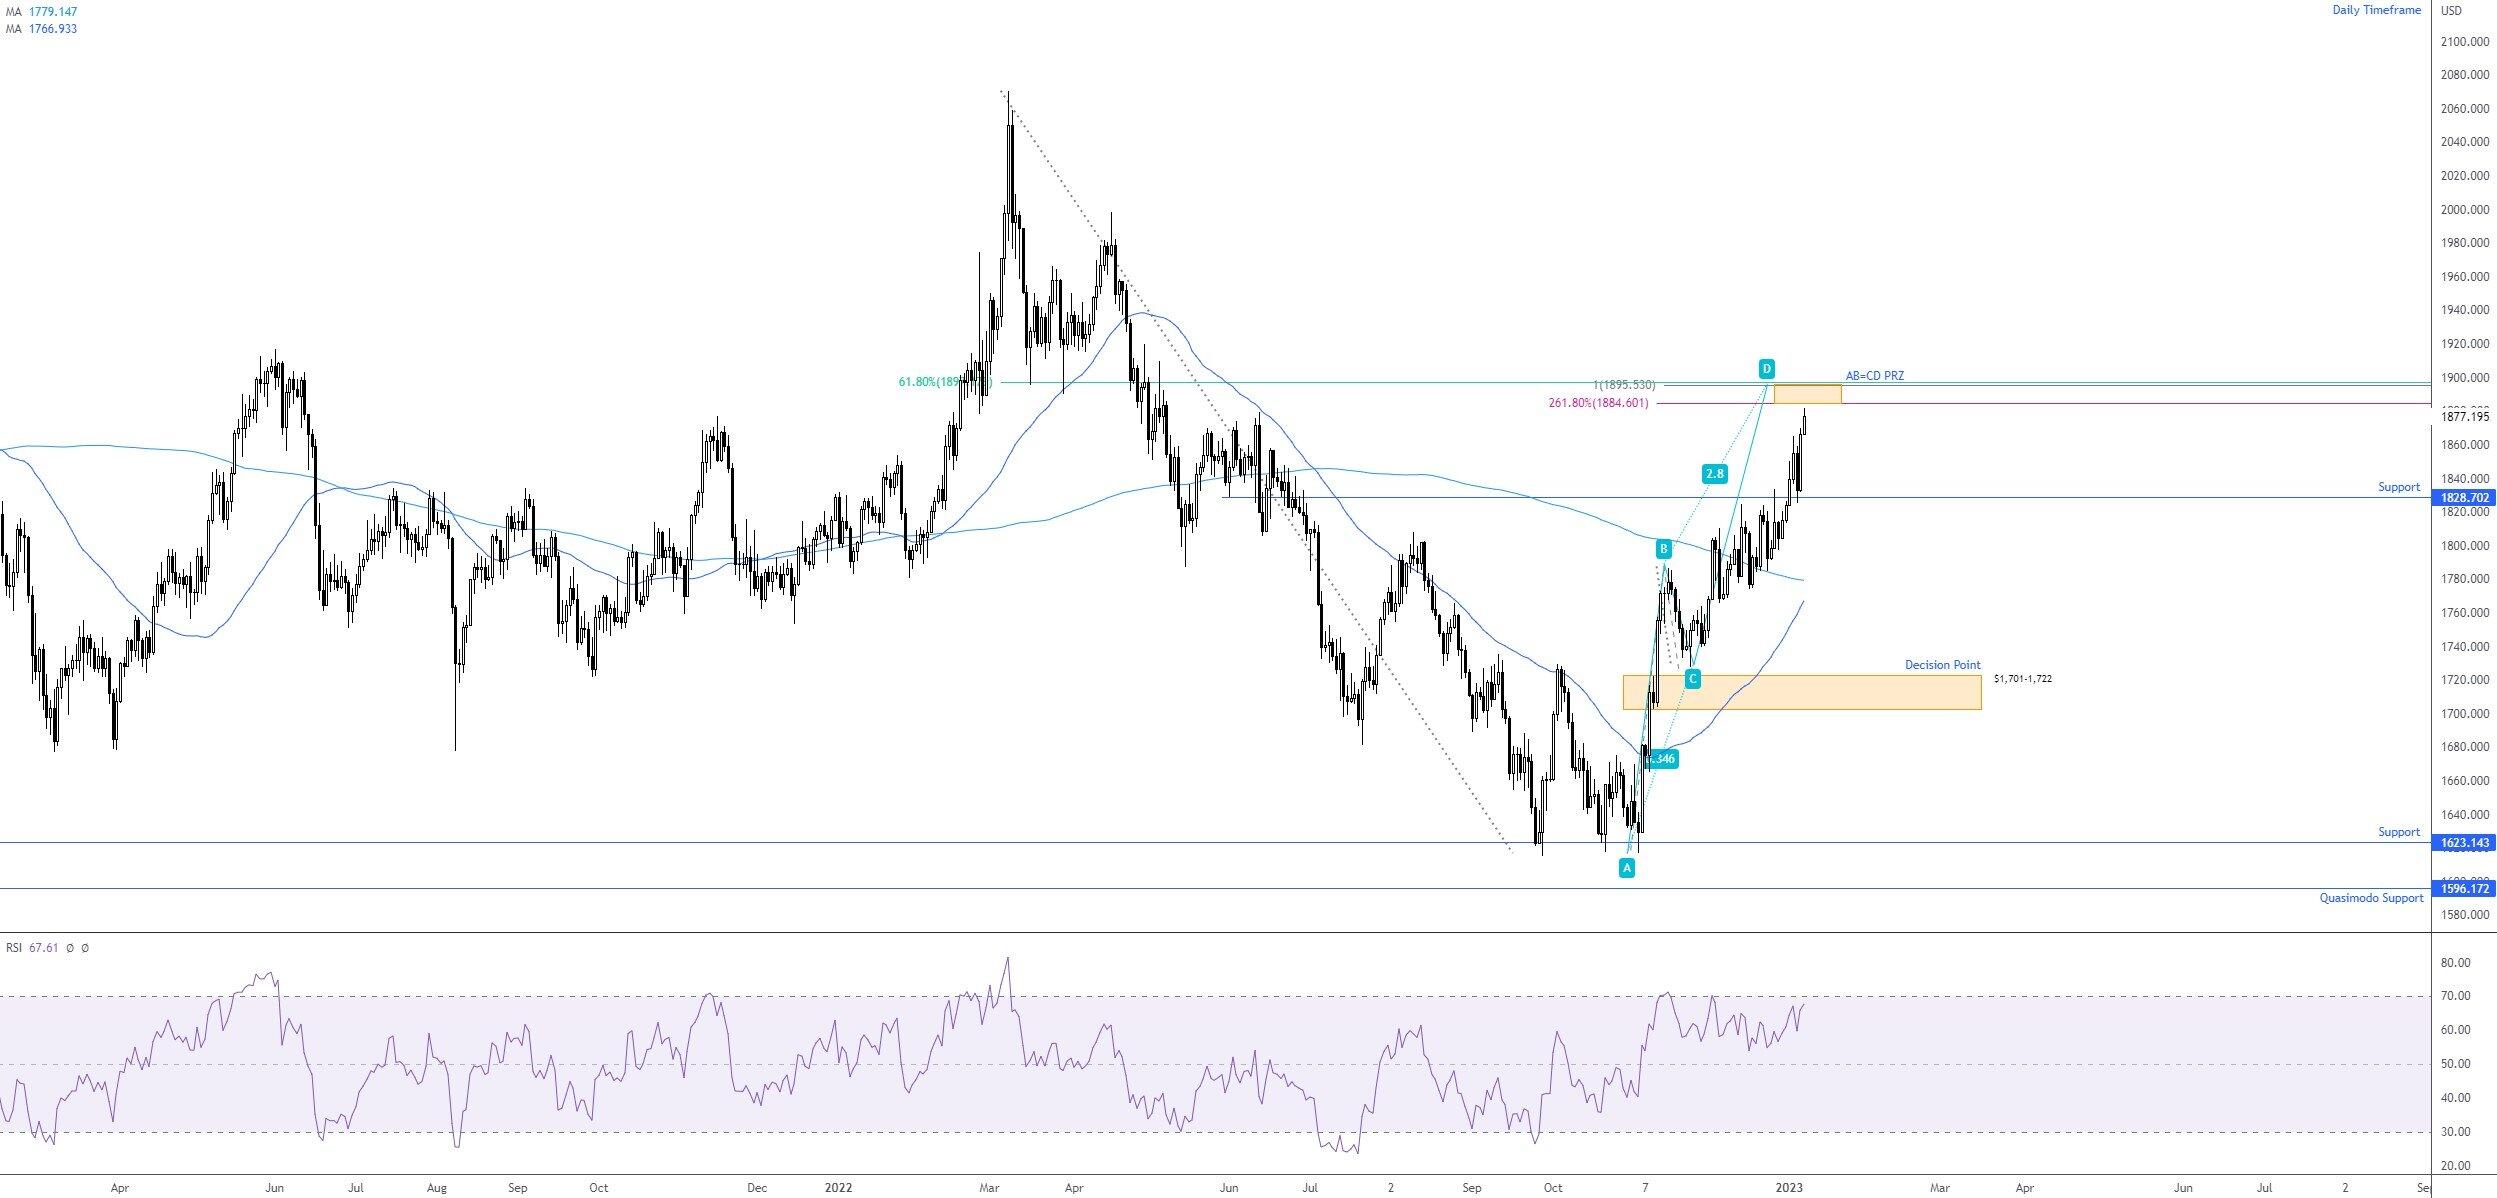
What does this mean for Gold?
The price of gold, in $ terms, is now on the doorstep of shaking hands with an AB=CD bearish formation, a 100% projection at $1,895. Complementing the area is a 61.8% Fibonacci retracement at $1,897 and a 2.618% Fibonacci extension at $1,884.
For anyone who follows Scott Carney’s work on Harmonics, you will note that the 2.618% ratio serves as the reciprocal ratio of the C point retracement of the AB-leg. This, as you can see, helps define the Potential Reversal Zone (PRZ: $1,897-1,884).
Therefore, with the dollar trading at a support area between 102.36 and 103.42, a bearish response from gold’s AB=CD zone could be in the offing in view of the inverse correlation between the two markets. How much of a bearish reaction, however, is difficult to estimate as the Fed is poised to begin slowing policy tightening which could weigh on the appeal for any dollar longs and ultimately hinder downside from gold’s AB=CD PRZ.
Daily chart for the US Dollar Index
Daily chart for the XAU/USD
Author

Aaron Hill
FP Markets
After completing his Bachelor’s degree in English and Creative Writing in the UK, and subsequently spending a handful of years teaching English as a foreign language teacher around Asia, Aaron was introduced to financial trading,


