WTI Oil Forecast: $75.00 ahead?
- Bullish outside-week candle signals continuation of the bull run.
- Bull flag breakout on the dailies.

WTI oil rose to $70.70/barrel in Asian session today - the highest level since November 2014 and the technical charts indicate the rally could be extended further to $75.00-$75.21 (100-month MA).
Weekly chart
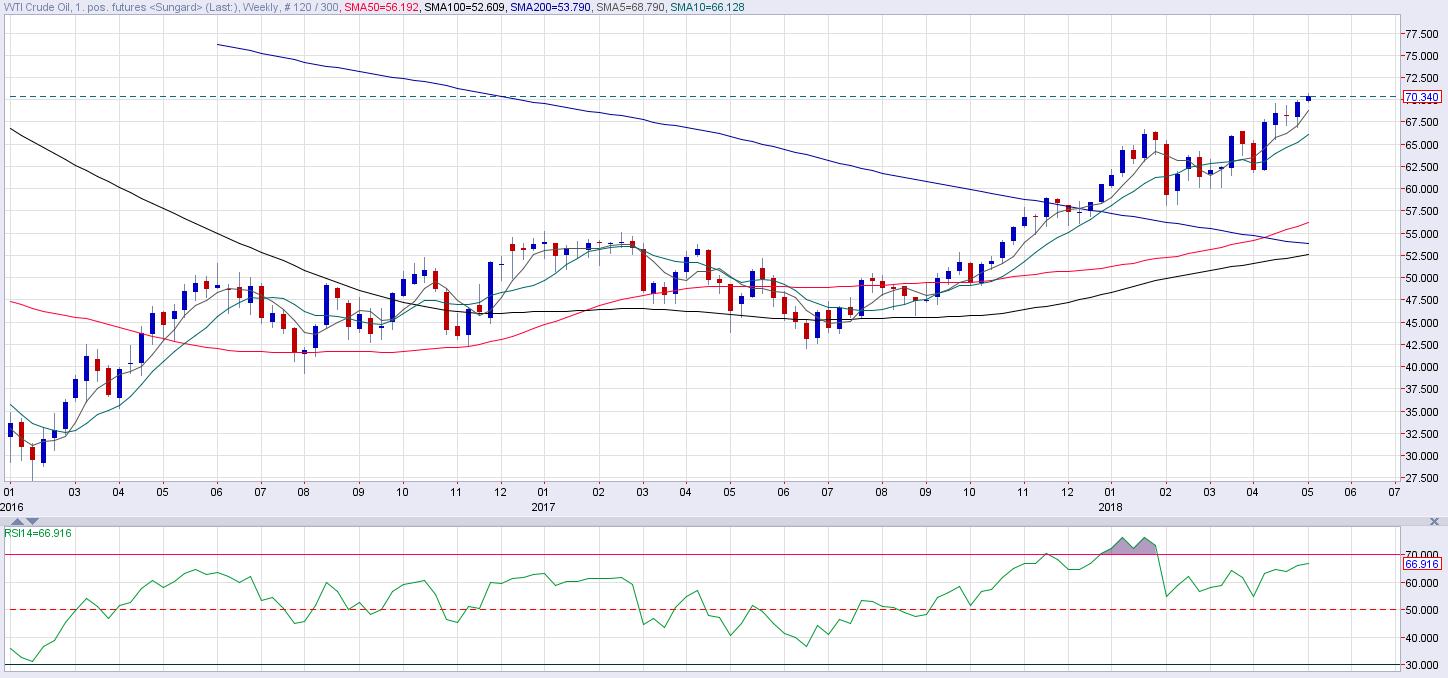
Source: Netstation, Netdania
Last week's bullish outside-week candle (engulfed previous week's doji) signals continuation of the rally from the June 2017 low of $42.06, also adds credence to the ascending (bullish) 5-week moving average (MA) and the 10-week MA and has opened the doors to $75.00 - $75.21 (100-month MA).
Daily chart
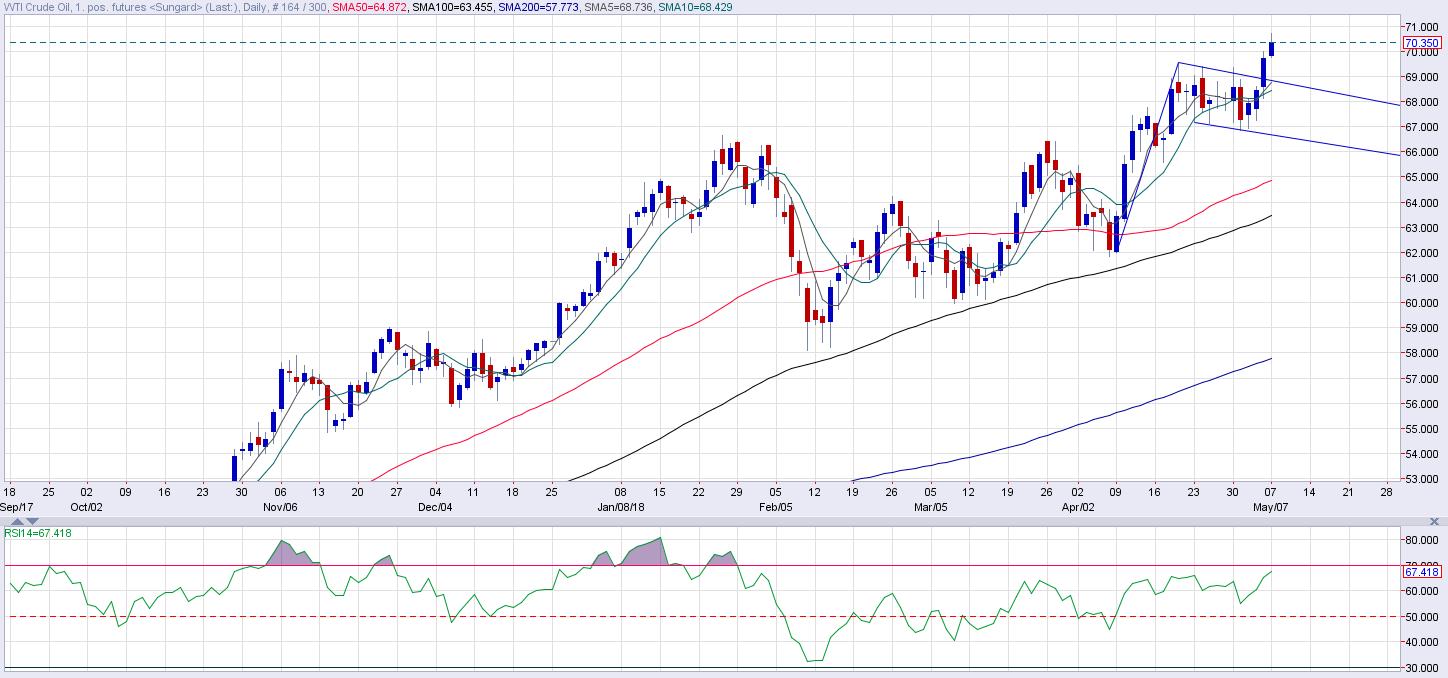
Source: Netstation, Netdania
The bull flag breakout, again a bullish continuation pattern, indicates scope for a rally to $75.80 (target as per the measured height method - pole height added to breakout price). The RSI is stationed at 67.00 and trending north, indicating enough scope for a rally to $75.00.
The 5-day MA and the 10-day MA are biased bullish. The 50, 100, 200-day MA are aligned in favor of the bulls.
View
WTI looks set to test $75.00 - $75.21 (100-month MA) in the near-term.
Only a daily close below the ascending (bullish) 10-day MA would neutralize the immediate bullish outlook.
A daily close below $66.86 (May 1 low) would indicate a short-term bullish-to-bearish trend change.
Author

Omkar Godbole
FXStreet Contributor
Omkar Godbole, editor and analyst, joined FXStreet after four years as a research analyst at several Indian brokerage companies.


