|

Crude Oil Elliott Wave technical analysis [Video]

WTI Elliott Wave analysis

WTI is extending the sell-off from January 2025 after finishing the corrective bounce in September when the commodity exchanged for just over $65. Meanwhile, the bigger picture shows sideways price action. As prices head to this lower boundary of the range, it appears, another bounce may not be far away.

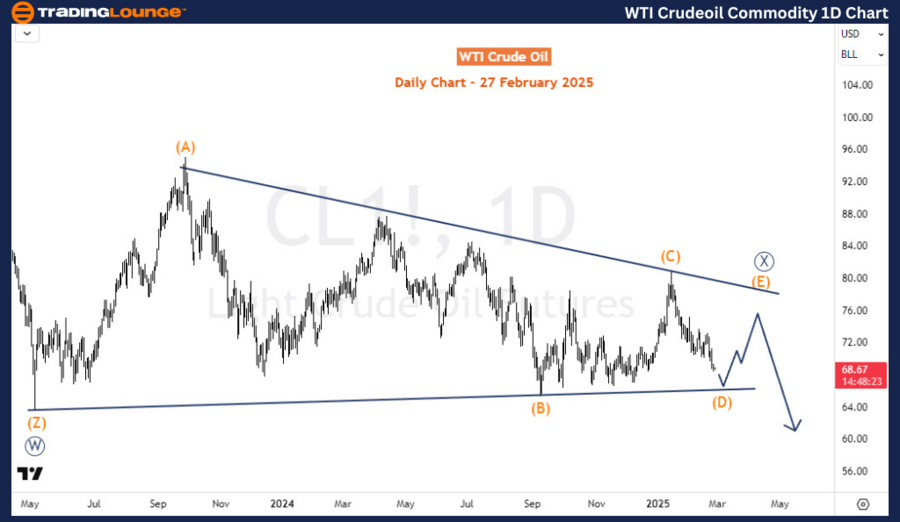
WTI daily chart analysis

The daily chart shows a triangle sideways structure that started in May 2023 after a massive sell-off from the almost $131 top it reached in March 2022 at the peak of the Russia-Ukraine war. The decline from March 2022 to May 2023 finished a zigzag/double zigzag structure identified as wave ((W)). The sideways price action from May 2023, while incomplete, is identified as wave ((X)). After wave ((X)), oil prices may plummet to prices below $50 to complete the bearish corrective cycle from March 2022.

Chart

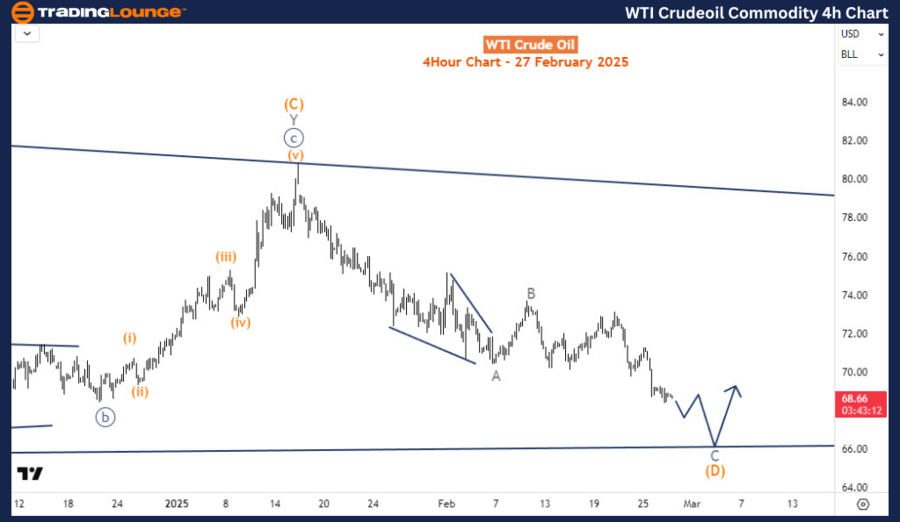
WTI four-hour chart analysis

The H4 chart shows the last stages of the triangle structure for wave ((X)). Price is currently in wave (D) of ((X)) from the January 2025 high. Price is precisely in the wave C of (D) and could extend to prices around $66 before the next bounce for wave (E) follows. However, a breach below $65.25 would mean this is not a triangle. Thus, traders can expect prices to falter toward $61.85-$54.59.

Chart

WTI Elliott Wave analysis [Video]

Author

Peter Mathers

Peter Mathers

TradingLounge

Peter Mathers started actively trading in 1982. He began his career at Hoei and Shoin, a Japanese futures trading company.

More from Peter Mathers
Share:

Editor's Picks

EUR/USD: US Dollar to remain pressured until uncertainty fog dissipates

Unimpressive European Central Bank left monetary policy unchanged for the fifth consecutive meeting. The United States first-tier employment and inflation data is scheduled for the second week of February. EUR/USD battles to remain afloat above 1.1800, sellers moving to the sidelines.

GBP/USD reclaims 1.3600 and above

GBP/USD reverses two straight days of losses, surpassing the key 1.3600 yardstick on Friday. Cable’s rebound comes as the Greenback slips away from two-week highs in response to some profit-taking mood and speculation of Fed rate cuts. In addition, hawkish comments from the BoE’s Pill are also collaborating with the quid’s improvement.

Gold jumps above $5,000 as China's gold buying drives demand

Gold price rises to near $5,035 during the early Asian session on Monday. The precious metal extends its recovery amid a weaker US Dollar and rising demand from central banks. The delayed release of the US employment report for January will be in the spotlight later on Wednesday.

Week ahead: US NFP and CPI data to shake Fed cut bets, Japan election looms

US NFP and CPI data awaited after Warsh’s nomination as Fed chief. Yen traders lock gaze on Sunday’s snap election. UK and Eurozone Q4 GDP data also on the agenda. China CPI and PPI could reveal more weakness in domestic demand.

Three scenarios for Japanese Yen ahead of snap election

The latest polls point to a dominant win for the ruling bloc at the upcoming Japanese snap election. The larger Sanae Takaichi’s mandate, the more investors fear faster implementation of tax cuts and spending plans. 

XRP rally extends as modest ETF inflows support recovery

Ripple is accelerating its recovery, trading above $1.36 at the time of writing on Friday, as investors adjust their positions following a turbulent week in the broader crypto market. The remittance token is up over 21% from its intraday low of $1.12.