WTI Crude Oil Elliott Wave technical analysis [Video]
![WTI Crude Oil Elliott Wave technical analysis [Video]](https://editorial.fxstreet.com/images/Markets/Commodities/Energy/Oil/Oil-WTI-platform-sea_XtraLarge.jpg)
WTI Elliott Wave analysis
As we approach the latter part of September 2024, coffee is currently retracing following the sell-off that began in late June. While this retracement may extend further, the long-term bearish cycle appears poised to push prices below the lows established in May 2023, potentially reaching levels last seen in mid-2021.
From a long-term perspective, WTI is in a bearish corrective phase. The commodity began its recovery from the impacts of COVID-19 in April 2020, which continued for 23 months, culminating in a robust impulse wave cycle that peaked in March 2022, when prices exceeded $130. Since that high, WTI has entered a bearish phase that we now identify as corrective.
Daily chart analysis
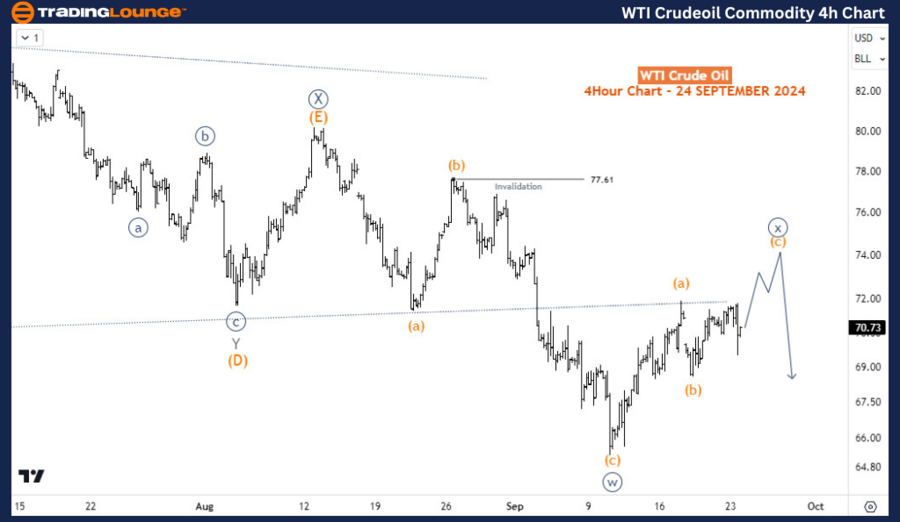
Analyzing the daily chart, we see that the corrective cycle from March 2022 is unfolding into a double zigzag pattern. After completing a zigzag at $64.50 in March 2023, prices moved sideways for over 17 months, indicating the formation of a larger double zigzag that may drive prices below $50 in the coming months.
The first leg of this pattern has completed a zigzag structure, labeled wave W (circled) of the primary degree. The second leg has formed a triangle structure, identified as wave X (circled) of the same degree. In early September, prices broke out of the triangle, signaling the beginning of the third leg—wave Y (circled). Consequently, the current bounce is expected to be a minor correction within the larger wave Y (circled) decline.
H4 chart analysis
On the H4 chart, wave Y (circled) initiated from the high of August 13, 2024, at $80.16, where wave X (circled) concluded with a triangle structure. The ongoing bounce could extend to the $74-$76 range to complete wave x (circled) of W, which serves as a sub-wave of Y (circled). Therefore, as long as the current bounce remains below $80.16, WTI is likely to favor downside movement in the long term.
Technical analyst: Sanmi Adeagbo.
WTI Elliott Wave analysis [Video]
Author

Peter Mathers
TradingLounge
Peter Mathers started actively trading in 1982. He began his career at Hoei and Shoin, a Japanese futures trading company.


