WTI crude bears put 64 dollars on the horizon [Video]
![WTI crude bears put 64 dollars on the horizon [Video]](https://editorial.fxstreet.com/images/Markets/Commodities/Energy/Oil/drilling-rig-workers-13770923_XtraLarge.jpg)
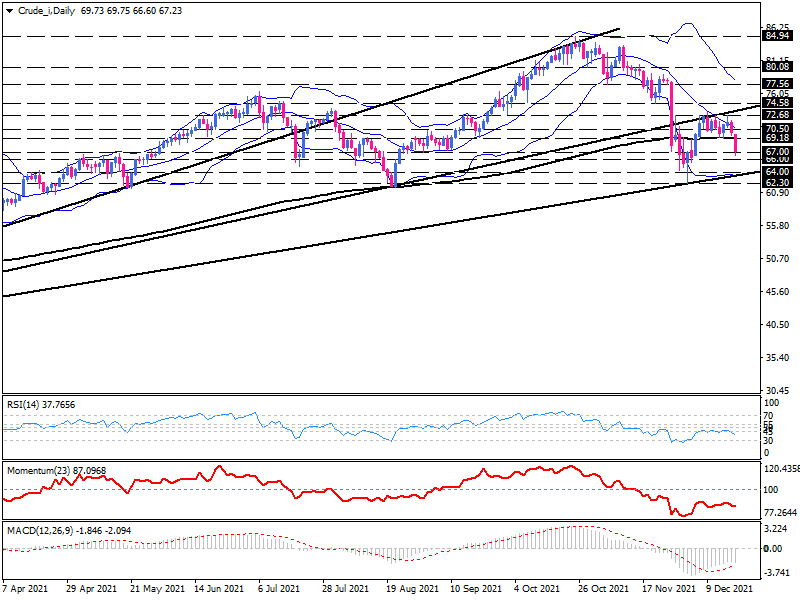
On the daily chart, following a period of range trading in the boundary of $ 72.68 and $ 69.18, WTI crude oil fell sharply in the Asia trading session earlier on Monday. Prices finally came under pressure, and sellers were able to move the market once again below the 200-day EMA.
This drop coincided with the rebound from the middle Bollinger Band and showed that the previously broken trend line has successfully acted as a resistance zone.
The divergence of the Bollinger Bands indicates that volatility is on the rise, placing $ 66 as an immediate support area on the market horizon ahead of the third Fan's trend line.
Momentum oscillators are exhibiting a downward tendency. After rebounding from the neutral zone, the RSI is slumping below 50-line. Momentum is in the selling area as well. The MACD indicates that moving averages are forming a negative divergence regarding price falls.
Short term technical outlook
On the 4-hour chart, after returning from the upper Bollinger band, the price has broken the support of 69.18 and is trading at the extreme of the lower band. A possible downtrend scenario is evaluated as long as the price is below the 200-exponential moving average and is in the lower half of the bands.
If the decline continues, we may see a clear breakthrough this barrier. In that case, the bear's next potential target could be $ 66 before dragging further to the lower support area in the smack of the new uptrend line around $ 64.
Nevertheless, the RSI reading in the oversold area suggests that sellers may take a break for a short time. Momentum, although located in bearish territory, is pointing south.
The sinking of the MACD bar in the selling region occurs while the signal line is on the verge of crossing below the zero line.
In the alternative scenario, the retreat of the sellers could bring the crude closer to the resistance of 69.18. As the bullish action intensifies, if the price oversteps this resistance, the next obstacle will come from $ 70.52. Losing this trench would push the crude to the previous area of interest at $72.68.
WTI Crude bears put 64 dollars on the horizon
Author

Ali Mortazavi
Errante
BEc, CMSA, Member of IFTA - International Federation of Technical Analysis, Associate Member of STA - Society of Technical Analysis (UK).


