The World Indices rally since the low at 10.2022. Many are already trading into new highs above the 2022 peak. The idea can be seen as bullish, and our expected wave III of (3) might have started. As it is known across the trading world, we at EWF are very bullish on the Indices. Contrary to many other traders and service, we do not see a correction in the Grand Super Cycle to happen.

We are constantly looking for an opportunity to buy the Indices. We have noticed a stock, $NVDA, which already corrects the Grand Super Cycle and trades into new highs. It is way ahead of the rest, which is a concern for us. As always, we do not recommend selling Indices. But we will explain later in the video something to keep in our mind. $NVDA is getting closer to the area between $451-$532 area. We expect buyers to take profit in the area before the acceleration into the wave (III). The idea that $NVDA can soon pullback will affect World Indices into a pullback. For those Indices which are still below the 2022 peak, they can even double off the peak.

$NVDA weekly Elliott Wave chart

Chart

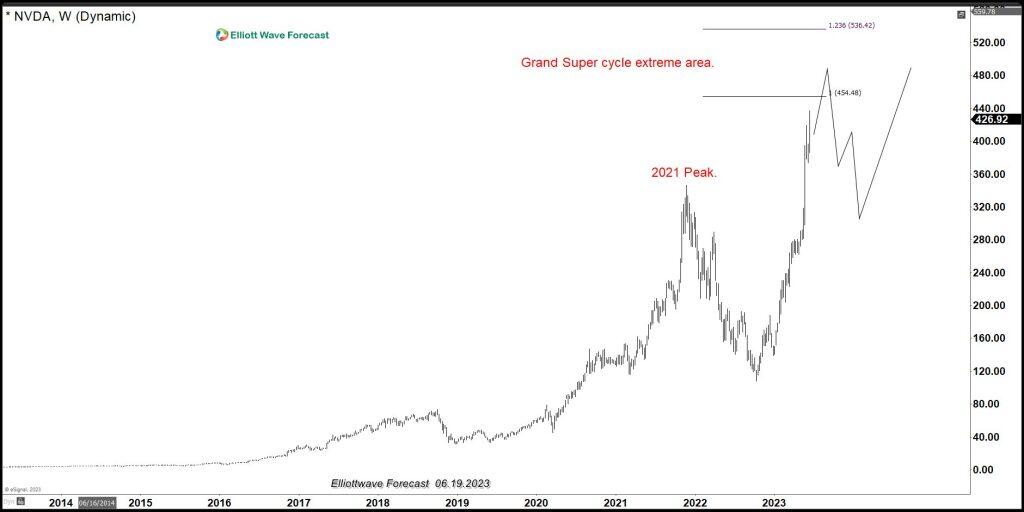
The weekly chart above shows $NVDA Grand Super Cycle reaching the target area. This should produce a three waves pullback. The same scenario happened in 2008 when the $HSI HKG (Hang Seng Index) reached the extreme area within the Grand Super Cycle. Those Indices that were lagging entered into a considerable selling. The following chart shows Hang Seng Index

Monthly Hang Seng Index chart

Chart

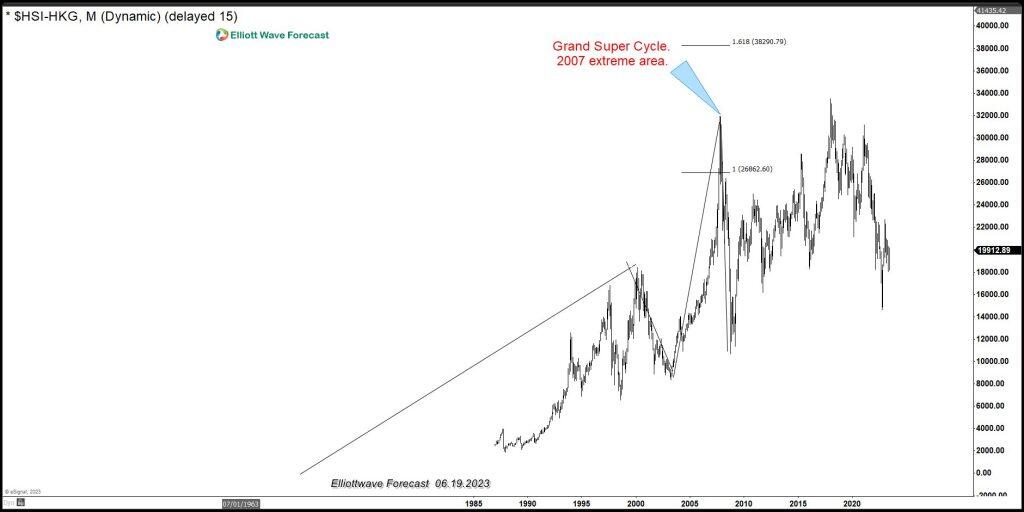
The chart above shows the Hang Seng Index back in 2008 when it reached the extreme area and the selling that followed. As always there are Indices and Symbols which are leading and ones which are lagging. Another interesting aspect is the $USDNOK. In 2008, the pair also within the extreme area and calling for a bounce, which is in complete alignment with the Hang Seng, and a $USDX rally or bounce.

Monthly chart of USD/NOK

Chart

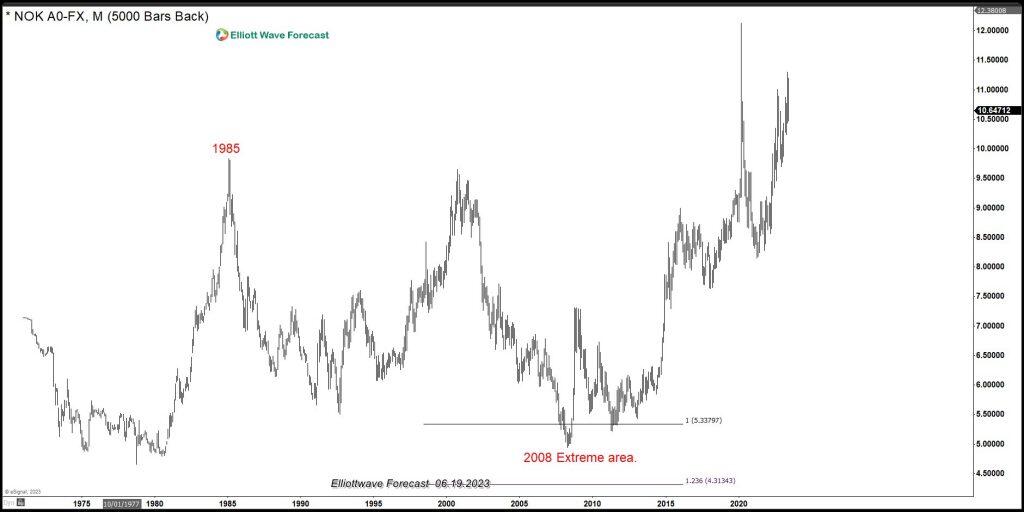
The chart above shows USDNOK reaches extreme area and the rally which follows from the area. The combination of the Hang Seng extreme in 2007 and the $USDNOK created a FLAT structure on the $SPX, which saw massive selling across the Market.

$SPX weekly Elliott Wave chart

SPX

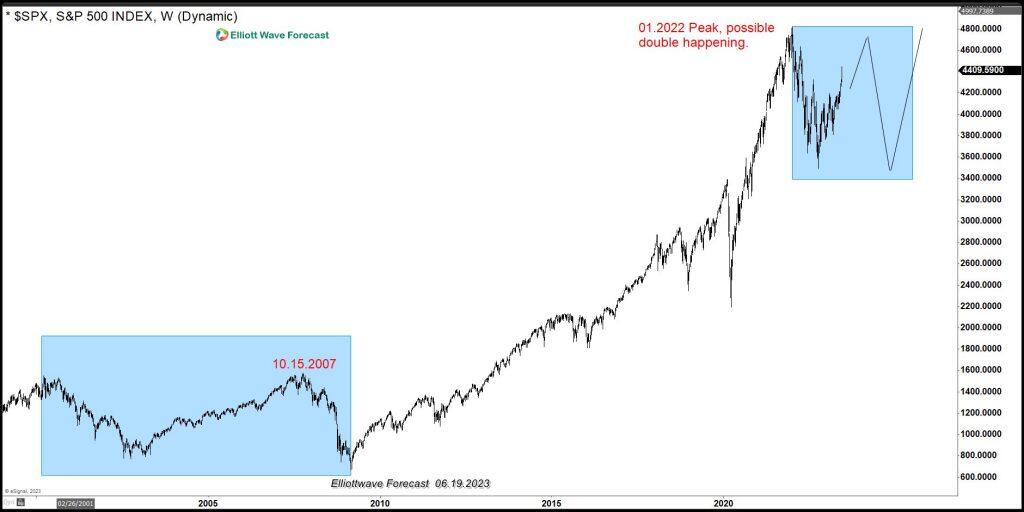
The weekly chart of $SPX above shows the highlighted blue area when the $SPX sold hard in 2008. Please note that the Index made a marginal new high before turning lower. It happened because $SPX lagged in relationship with the Hang Seng. Now, the $USDMXN (Peso) is doing the same as the $USDNOK did in 2008. It is reaching the extreme area from the peak in 2020, which will again propose a bounce or rally to happen soon. Here is the latest Weekly chart:

$USD/MXN Weekly Elliott Wave chart

USDMXN

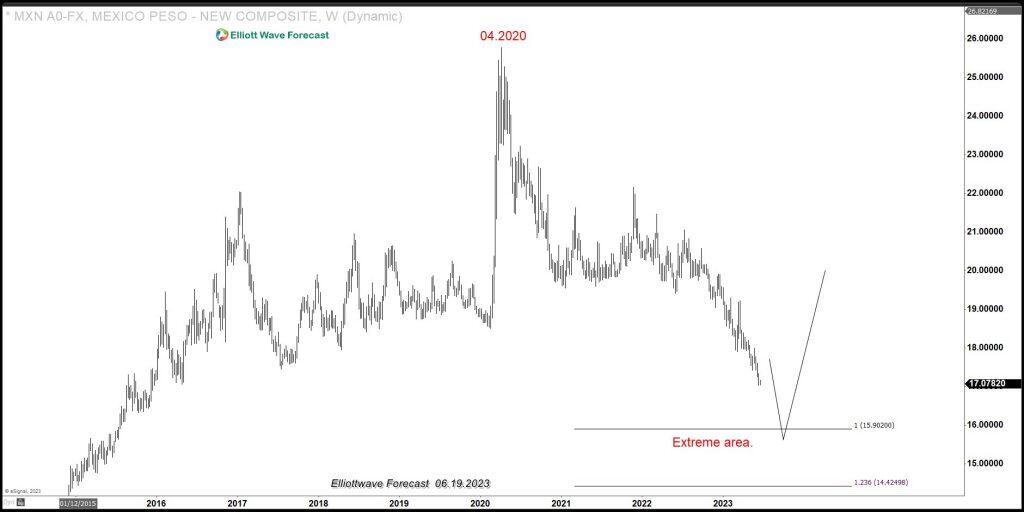
The weekly chart above shows the area where the bounce should happen again. We believe in the idea that some Indices like $SPX lag symbol such as $NVDA. The $USDX, as represented by the $USDMXN above, soon should bounce. This in turn can create another irregular or double correction from the last significant peak across the Indices group. Can History repeat itself?

FURTHER DISCLOSURES AND DISCLAIMER CONCERNING RISK, RESPONSIBILITY AND LIABILITY Trading in the Foreign Exchange market is a challenging opportunity where above average returns are available for educated and experienced investors who are willing to take above average risk. However, before deciding to participate in Foreign Exchange (FX) trading, you should carefully consider your investment objectives, level of xperience and risk appetite. Do not invest or trade capital you cannot afford to lose. EME PROCESSING AND CONSULTING, LLC, THEIR REPRESENTATIVES, AND ANYONE WORKING FOR OR WITHIN WWW.ELLIOTTWAVE- FORECAST.COM is not responsible for any loss from any form of distributed advice, signal, analysis, or content. Again, we fully DISCLOSE to the Subscriber base that the Service as a whole, the individual Parties, Representatives, or owners shall not be liable to any and all Subscribers for any losses or damages as a result of any action taken by the Subscriber from any trade idea or signal posted on the website(s) distributed through any form of social-media, email, the website, and/or any other electronic, written, verbal, or future form of communication . All analysis, trading signals, trading recommendations, all charts, communicated interpretations of the wave counts, and all content from any media form produced by www.Elliottwave-forecast.com and/or the Representatives are solely the opinions and best efforts of the respective author(s). In general Forex instruments are highly leveraged, and traders can lose some or all of their initial margin funds. All content provided by www.Elliottwave-forecast.com is expressed in good faith and is intended to help Subscribers succeed in the marketplace, but it is never guaranteed. There is no “holy grail” to trading or forecasting the market and we are wrong sometimes like everyone else. Please understand and accept the risk involved when making any trading and/or investment decision. UNDERSTAND that all the content we provide is protected through copyright of EME PROCESSING AND CONSULTING, LLC. It is illegal to disseminate in any form of communication any part or all of our proprietary information without specific authorization. UNDERSTAND that you also agree to not allow persons that are not PAID SUBSCRIBERS to view any of the content not released publicly. IF YOU ARE FOUND TO BE IN VIOLATION OF THESE RESTRICTIONS you or your firm (as the Subscriber) will be charged fully with no discount for one year subscription to our Premium Plus Plan at $1,799.88 for EACH person or firm who received any of our content illegally through the respected intermediary’s (Subscriber in violation of terms) channel(s) of communication.

Recommended Content


Recommended Content

Editors’ Picks

Gold trades near record-high, stays within a touching distance of $3,100

Gold trades near record-high, stays within a touching distance of $3,100

Gold clings to daily gains and trades near the record-high it set above $3,080 earlier in the day. Although the data from the US showed that core PCE inflation rose at a stronger pace than expected in February, it failed to boost the USD.

Gold News
EUR/USD turns positive above 1.0800

EUR/USD turns positive above 1.0800

The loss of momentum in the US Dollar allows some recovery in the risk-associated universe on Friday, encouraging EUR/USD to regain the 1.0800 barrier and beyond, or daily tops.

EUR/USD News
GBP/USD picks up pace and retests 1.2960

GBP/USD picks up pace and retests 1.2960

GBP/USD now capitalises on the Greenback's knee-jerk and advances to the area of daily peaks in the 1.2960-1.2970 band, helped at the same time by auspicious results from UK Retail Sales.

GBP/USD News
Donald Trump’s tariff policies set to increase market uncertainty and risk-off sentiment

Donald Trump’s tariff policies set to increase market uncertainty and risk-off sentiment

US President Donald Trump’s tariff policies are expected to escalate market uncertainty and risk-off sentiment, with the Kobeissi Letter’s post on X this week cautioning that while markets may view the April 2 tariffs as the "end of uncertainty," it anticipates increased volatility. 

Read more
US: Trump's 'Liberation day' – What to expect?

US: Trump's 'Liberation day' – What to expect?

Trump has so far enacted tariff changes that have lifted the trade-weighted average tariff rate on all US imports by around 5.5-6.0%-points. While re-rerouting of trade will decrease the effectiveness of tariffs over time, the current level is already close to the highest since the second world war. 

Read more
The Best brokers to trade EUR/USD

The Best brokers to trade EUR/USD

SPONSORED Discover the top brokers for trading EUR/USD in 2025. Our list features brokers with competitive spreads, fast execution, and powerful platforms. Whether you're a beginner or an expert, find the right partner to navigate the dynamic Forex market.

Read More

Majors

Cryptocurrencies

Signatures

Best Brokers of 2025