USD: Sept '24 is Up at 104.035.

Energies: Aug '24 Crude is Down at 81.02.

Financials: The Sept '24 30 Year T-Bond is Down 15 ticks and trading at 119.11

Indices: The Sept '24 S&P 500 emini ES contract is 16 ticks Higher and trading at 5598.00.

Gold: The Aug'24 Gold contract is trading Down at 2409.02  

Initial conclusion

This is not a correlated market.  The USD is Up and Crude is Down which is normal, but the 30 Year T-Bond is trading Down.  The Financials should always correlate with the US dollar such that if the dollar is Higher, then the bonds should follow and vice-versa. The S&P is Higher and Crude is trading Lower which is correlated. Gold is trading Lower which is correlated with the US dollar trading Up.  I tend to believe that Gold has an inverse relationship with the US Dollar as when the US Dollar is down, Gold tends to rise in value and vice-versa. Think of it as a seesaw, when one is up the other should be down. I point this out to you to make you aware that when we don't have a correlated market, it means something is wrong. As traders you need to be aware of this and proceed with your eyes wide open.  Asia traded Lower with the exception of the Shanghai exchange.   Currently all of Europe is trading Lower. 

Possible challenges to traders

  • FOMC Member Williams Speaks at 10:40 AM EST.  This is Major.

  • FOMC Member Bostic Speaks at 1 PM EST.  This is Major.

Traders, please note that we've changed the Bond instrument from the 10 year (ZN) to the 2 year (ZT).  They work exactly the same.  

We've elected to switch gears a bit and show correlation between the 10-year Treasury notes (ZN) and the S&P futures contract.  The YM contract is the Dow Jones Industrial Average, and the purpose is to show reverse correlation between the two instruments.  Remember it's likened to a seesaw, when up goes up the other should go down and vice versa.  

Yesterday the ZT migrated Higher at around 8:30 AM EST after the economic news was released.  If you look at the charts below the ZT gave a signal at around 8:30 AM and started its Upward climb.  Look at the charts below and you'll see a pattern for both assets. The Dow moved Lower at 8:30 AM and the ZT moved Higher at around the same time.  These charts represent the newest version of BarCharts, and I've changed the timeframe to a 15-minute chart to display better.  This represented a Long opportunity on the 2-year note, as a trader you could have netted about 30 plus ticks per contract on this trade.   Each tick is worth $7.625.  Please note: the front month for ZT is Sept and the Dow is now Sept '24.  I've changed the format to filled Candlesticks (not hollow) such that it may be more apparent and visible.  

Charts courtesy of Barcharts

Chart

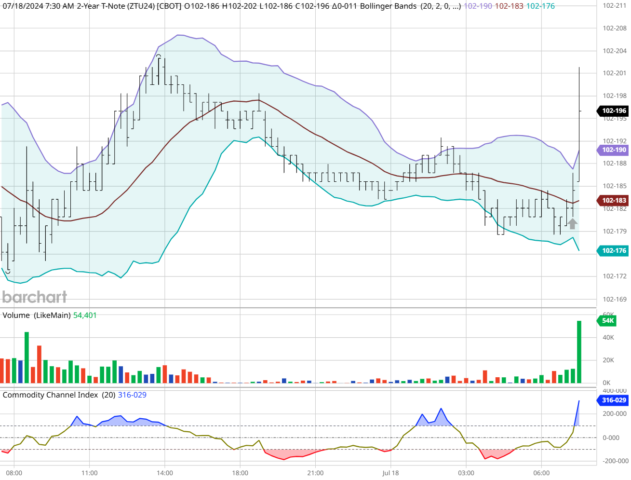
ZT -Sept 2024 - 07/18/24

Chart

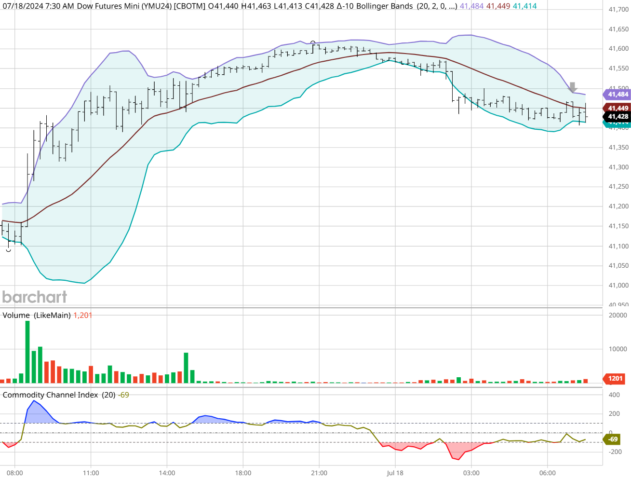
Dow - Sept 2024 - 07/18/24

Bias

Yesterday we gave the markets an Upside bias as we felt there was enough evidence of market correlation.  The markets however had other ideas as the Dow fell by 533 points and the other indices lost ground as well. Today we aren't dealing with a correlated market and our bias is to the Upside.

Could this change? Of Course.  Remember anything can happen in a volatile market. 

Commentary

Yesterday when we viewed the markets, we felt there was enough evidence to call for an Upside Day and initially the markets rose.  After 11 AM EST it became apparent that the markets would drop, and they did.  Additionally, it was rumored that President Biden may decide to drop out of the race altogether as he now has Covid (again) and the major players of the Democratic party are clamoring him to step down.  Former President Obama, Former Speaker Pelosi and other major democrats are advising him to consider stepping down.  No doubt this had an effect on yesterday's markets.  Will the same hold true today?  Only time will tell...

Trading performance displayed herein is hypothetical. The following Commodity Futures Trading Commission (CFTC) disclaimer should be noted.

Hypothetical performance results have many inherent limitations, some of which are described below. No representation is being made that any account will or is likely to achieve profits or losses similar to those shown.

In fact, there are frequently sharp differences between hypothetical performance results and the actual results subsequently achieved by any particular trading program. One of the limitations of hypothetical performance trading results is that they are generally prepared with the benefit of hindsight.

In addition, hypothetical trading does not involve financial risk, and no hypothetical trading record can completely account for the impact of financial risk in actual trading. For example, the ability to withstand losses or to adhere to a particular trading program in spite of trading losses are material points which can also adversely affect actual trading results.

There are numerous other factors related to the markets in general or to the implementation of any specific trading program which cannot be fully accounted for in the preparation of hypothetical performance results and all of which can adversely affect actual trading results.

Trading in the commodities markets involves substantial risk and YOU CAN LOSE A LOT OF MONEY, and thus is not appropriate for everyone. You should carefully consider your financial condition before trading in these markets, and only risk capital should be used.

In addition, these markets are often liquid, making it difficult to execute orders at desired prices. Also, during periods of extreme volatility, trading in these markets may be halted due to so-called “circuit breakers” put in place by the CME to alleviate such volatility. In the event of a trading halt, it may be difficult or impossible to exit a losing position.

Recommended Content


Recommended Content

Editors’ Picks

EUR/USD struggles to recover above 1.0900 as markets remain cautious

EUR/USD struggles to recover above 1.0900 as markets remain cautious

EUR/USD stays on the back foot and trades below 1.0900 following Thursday's sharp decline. Dovish comments from European Central Bank officials and the risk-averse market atmosphere make it difficult for the pair to stage a rebound on Friday.

EUR/USD News

GBP/USD falls toward 1.2900, looks to post weekly losses

GBP/USD falls toward 1.2900, looks to post weekly losses

GBP/USD continues to push lower toward 1.2900 in the American session on Friday. Disappointing Retail Sales data from the UK, combined with the US Dollar (USD) recovery amid souring mood, causes the pair to stay under bearish pressure ahead of the weekend.

GBP/USD News

Gold extends daily slide, trades near $2,400

Gold extends daily slide, trades near $2,400

Gold's correction from the record-high set earlier in the week deepens on Friday. With the US Dollar (USD) benefiting from safe-haven flows and the 10-year US yield holding steady above 4.2%, XAU/USD tests $2,400 and looks to post small weekly losses

Gold News

Top 10 crypto market movers as Bitcoin and Ethereum hold steady ahead of $1.8 billion options expiry

Top 10 crypto market movers as Bitcoin and Ethereum hold steady ahead of $1.8 billion options expiry

Bitcoin and Ethereum hold steady above $64,000 and $3,400 as $1.8 billion in options expire on Friday. WazirX hack of $230 million potentially linked to Lazarus Group ushers correction in Shiba Inu, among other assets. 

Read more

Week ahead – Flash PMIs, US GDP and BoC decision on tap

Week ahead – Flash PMIs, US GDP and BoC decision on tap

US data awaited amid overly dovish Fed rate cut bets. July PMIs to reveal how economies entered H2. BoC decides on monetary policy, may cut rates again.

Read more

Majors

Cryptocurrencies

Signatures