Why the COVID-19 pandemic is serious? And why it’s good for Gold

What do chess and the epidemic have in common? What is the difference between linear and exponential growth? Should we really worry about this pandemic? And last but not least, how will the COVID-19 crisis affect the gold prices? We invite you thus to read our today's article and find out answers to these questions!
According to the legend, a ruler, who liked very much the new game of chess, wanted to reward an inventor of chess. So, he asked him about his wish. The inventor requested his king to give him one grain of rice on the first square of the chessboard, two grains on the second square, four on the third square and so on. The ruler was amazed at the modesty of the request – until it turned out that there was not so much rice in the whole kingdom!
Why I'm telling you this old legend in the article about COVID-19 pandemic and gold? Well, the reason is that it shows the power of exponential growth. You see, the total number of requested grains equals 18,446,744,073,709,551,615, much more than most people with the exception of mathematicians would expect. The problem is that people don't grasp exponential growth. They are used to thinking in linear terms. The differences between the linear and exponential growth are clearly seen on the chart below.
Chart 1: Linear growth (blue line) and exponential growth (red line)
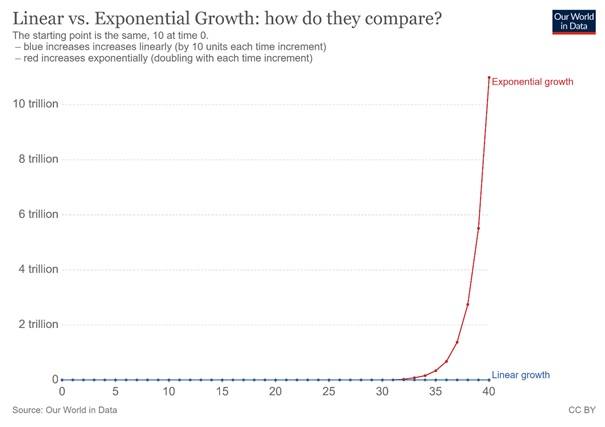
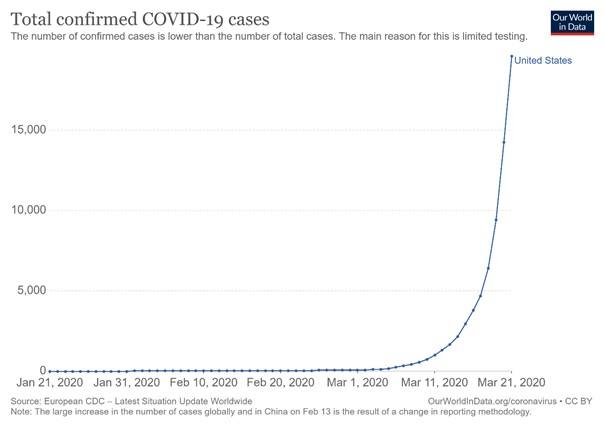
The key here is that epidemic is an exponential phenomenon. The epidemiological curve is an exponential curve, not linear curve (actually, it is a logistic curve, but let's aside this – you can watch this excellent video for more details). This is why all the comparisons between COVID-19 and flu are misguided. It's true that seasonal flu kills more people than COVID- 19 – so far. But it can change very quickly due to the exponential growth of the current epidemic. It's true that still the total number of cases in the US is moderate. But it can change soon. Just look at the chart below: does it look like a linear or exponential growth? This is how the latter works – it starts slowly but at some point, it escalates quickly.
Chart 2: Total confirmed COVID-19 cases in the United States by March 21, 2020
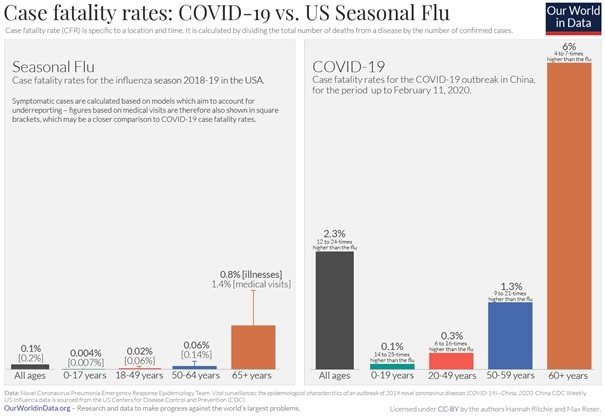
Another issue is that COVID-19 is more contagious (one person infects on average 2- 2.5 person versus 1.3), it has longer incubation period (so people can infect others because they even do not know that they are infected themselves as they have no symptoms), higher hospitalization rate (19 versus 2 percent) and higher case fatality rate, as the chart below shows.
Chart 3: Comparison between COVID-19 and US seasonal flue in terms of case fatality rates
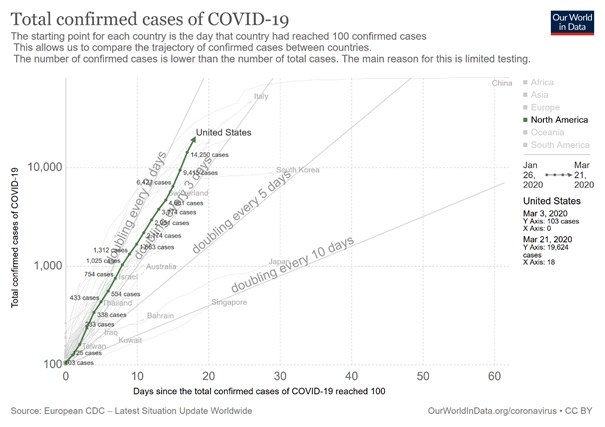
Unfortunately, many Americans still underestimate the gravity of the situation. But they shouldn't. As the chart below shows, the epidemiological curve for the US is actually steeper than in Italy, the worst hit country in Europe.
Chart 4: Total confirmed cases of COVID-19 in the US and other countries since the country reached 100 confirmed cases
To make matters worse, the US has only 2.8 total hospital beds per 1000 inhabitants, fewer than not only in Japan (13.1) but also than Italy (3.2). It means that the US healthcare system is not prepared for the pandemic and that it would be overwhelmed. When the healthcare system collapses, the mortality rate goes up, because hospitals cannot efficiently care for all the patients.
What does it all imply for the gold market? Well, we want to be wrong, but we are afraid that the US will be severely hit. When Americans realize that the worst is yet ahead of the States, the stock market can plunge even further. Given the fact that equity investors liquidate gold holdings to raise cash, gold can follow the S&P 500 Index. But after the fall, the safe-haven nature of gold should reemerge. When people start to appreciate the dangers of the increased money supply, inflation, and expanded public debt, they should turn to gold, as they did in the aftermath of the Great Recession.
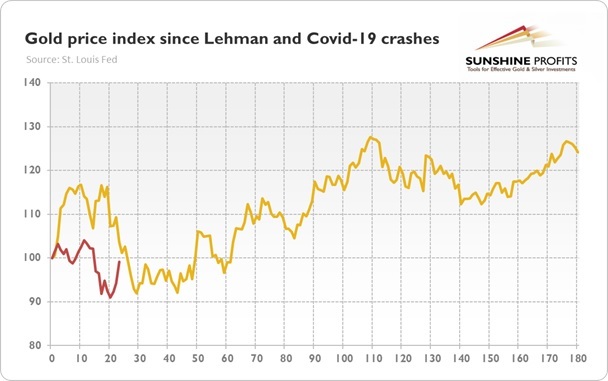
Of course, the replay is not guaranteed, as the current crisis is different from the financial crisis of 2008, but so far the gold price index behaves since the COVID-19 stock market crash very similar to its performance since the Lehman Brothers stock market crash, as the chart below shows.
Chart 5: Gold price index since Lehman Brothers and COVID-19 crashes for several dozen days (starting points normalized to 100 for September 15, 2008 and February 20, 2020)
If history is any guide, it means that although it can go lower first, gold should start rallying within weeks. The gold market is volatile right now and we can see more selling in the hunt for liquidity, but the fundamentals have not been this positive for a long time: the world entered global recession, central banks slashed interest rates to zero and reintroduced quantitative easing, while the governments expanded their expenditures, fiscal deficits and public debts. When fundamentals come to the fore, gold should go up.
Want free follow-ups to the above article and details not available to 99%+ investors? Sign up to our free newsletter today!
Want free follow-ups to the above article and details not available to 99%+ investors? Sign up to our free newsletter today!
Author

Arkadiusz Sieroń
Sunshine Profits
Arkadiusz Sieroń received his Ph.D. in economics in 2016 (his doctoral thesis was about Cantillon effects), and has been an assistant professor at the Institute of Economic Sciences at the University of Wrocław since 2017.


