When Joe talks, markets listen
USD: Sept '24 is Down at 102.915.
Energies: Sept '24 Crude is Down at 75.11.
Financials: The Sept '24 30 Year T-Bond is Up 24 ticks and trading at 124.01
Indices: The Sept '24 S&P 500 emini ES contract is 26 ticks Lower and trading at 5561.00.
Gold: The Dec'24 Gold contract is trading Up at 2506.60
Initial conclusion
This is not a correlated market. The USD is Down and Crude is Down which is not normal, but the 30 Year T-Bond is trading Up. The Financials should always correlate with the US dollar such that if the dollar is Higher, then the bonds should follow and vice-versa. The S&P is Lower and Crude is trading Lower which is not correlated. Gold is trading Higher which is correlated with the US dollar trading Down. I tend to believe that Gold has an inverse relationship with the US Dollar as when the US Dollar is down, Gold tends to rise in value and vice-versa. Think of it as a seesaw, when one is up the other should be down. I point this out to you to make you aware that when we don't have a correlated market, it means something is wrong. As traders you need to be aware of this and proceed with your eyes wide open. All of Asia traded mainly Higher. All of Europe is trading mainly Higher except the London exchange.
Possible challenges to traders
-
Building Permits are out at 8:30 AM EST. This is Major.
-
Housing Starts are out at 8:30 AM EST. This is Major.
-
Prelim UoM Consumer Sentiment is out at 10 AM EST. This is Major.
-
Prelim UoM Inflation Expectations is out at 10 AM EST. This is Major.
-
FOMC Member Goolsbee Speaks at 1:25 PM EST. This is Major.
Traders, please note that we've changed the Bond instrument from the 10 year (ZN) to the 2 year (ZT). They work exactly the same.
We've elected to switch gears a bit and show correlation between the 10-year Treasury notes (ZN) and the S&P futures contract. The YM contract is the Dow Jones Industrial Average, and the purpose is to show reverse correlation between the two instruments. Remember it's likened to a seesaw, when up goes up the other should go down and vice versa.
Yesterday the ZT migrated Higher at around 8:30 AM EST. If you look at the charts below the ZT gave a signal at around 8:30 AM after the 8:30 AM reports were released and started its Downward slide. Look at the charts below and you'll see a pattern for both assets. The Dow moved Higher at 8:30 AM and the ZT moved Lower at around the same time. These charts represent the newest version of BarCharts, and I've changed the timeframe to a 15-minute chart to display better. This represented a Short opportunity on the 2-year note, as a trader you could have netted about 50 plus ticks per contract on this trade. Each tick is worth $7.625. Please note: the front month for ZT is Sept and the Dow is now Sept '24. I've changed the format to filled Candlesticks (not hollow) such that it may be more apparent and visible.
Charts courtesy of Barcharts
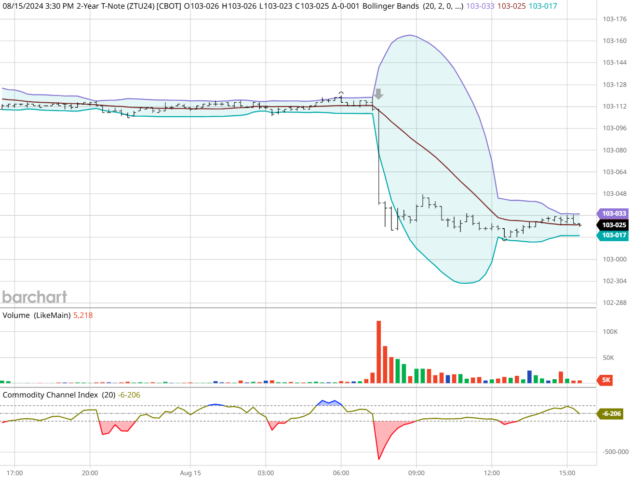
ZT -Sept 2024 - 08/15.24
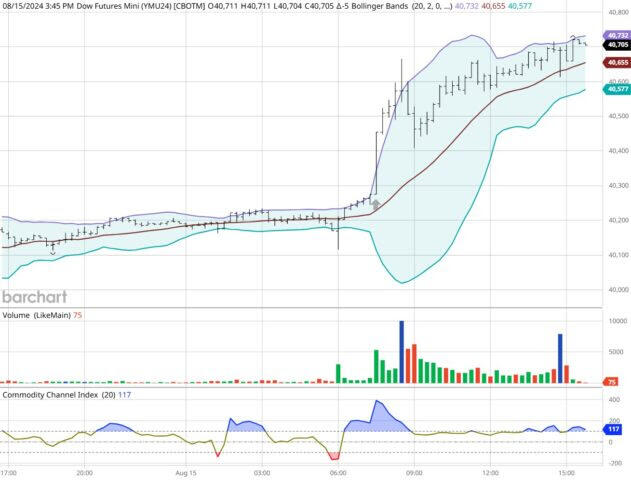
Dow - Sept 2024- 08/15/24
Bias
Yesterday we gave the markets a Neutral or Mixed bias as we had an overwhelming 16 economic reports in one day. The markets migrated Higher as the Dow closed 555 points HIgher and the other indices traded Higher as well. Today we aren't dealing with a correlated market and our bias is to the Downside.
Could this change? Of Course. Remember anything can happen in a volatile market.
Commentary
Yesterday we saw Kamela and Joe talking to political crowd in Maryland yesterday. I must say I've never seen Joe Biden do better. He spoke about the price of prescription drugs and how they will be reduced in price going forward. The markets reacted positively to this as the Dow closed 555 points Higher and the other indices closed Higher as well. The S&P was Up 81 and the Nasdaq up 402. Today we don't have 16 economic reports to speak of. We do have Building Permits, Housing Starts, Preliminary numbers for Consumer Sentiment and Inflation; all of which are Major. Will this keep the momentum positive going forward? Only time will tell...
Author

Nick Mastrandrea
Market Tea Leaves


