|

Wheat Elliott Wave technical analysis [Video]

Wheat Elliott Wave analysis

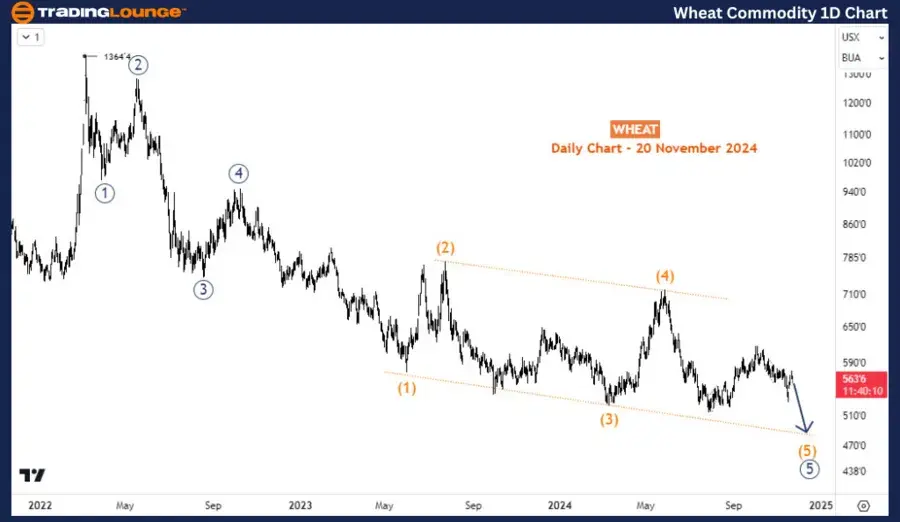
Wheat is returning to the lows of July 2024, where it last had a significant bounce against the bearish trend from March 2022. However, the recent decline from October may have an eye for the 26 July low as sellers’ control main gain momentum again, leading prices toward $500 and even below.

On the daily chart, the bearish run from March 2022’s high of 1364 is clearly in the last stage of an impulse wave structure. Meanwhile, the 5th wave is emerging into an ending diagonal structure which has been in its 5th wave since May 2024. Wave (5) of ((5)) is making a zigzag as usually seen in diagonal structures. However, it appears wave (5) is not yet finished.

Chart

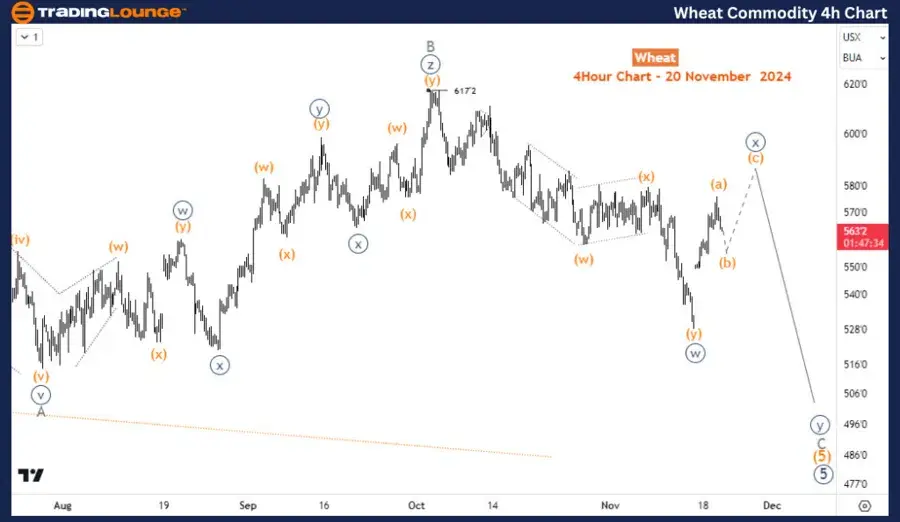
On the H4 chart, Wave B of (5) ended at 617 (Oct 2024 high) and has been down for wave C of (5) which should extend below the July 2024 low where wave A finished. The current rally is the wave ((x)) of C which should finish below 617 if this idea will be valid. Further decline is expected to continue after wave ((x)), toward 500 or below as earlier mentioned.

Chart

Technical analyst: Sanmi Adeagbo.

Wheat Elliott Wave analysis [Video]

Author

Peter Mathers

Peter Mathers

TradingLounge

Peter Mathers started actively trading in 1982. He began his career at Hoei and Shoin, a Japanese futures trading company.

More from Peter Mathers
Share:

Editor's Picks

EUR/USD hits two-day highs near 1.1820

EUR/USD picks up pace and reaches two-day tops around 1.1820 at the end of the week. The pair’s move higher comes on the back of renewed weakness in the US Dollar amid growing talk that the Fed could deliver an interest rate cut as early as March. On the docket, the flash US Consumer Sentiment improves to 57.3 in February.

GBP/USD reclaims 1.3600 and above

GBP/USD reverses two straight days of losses, surpassing the key 1.3600 yardstick on Friday. Cable’s rebound comes as the Greenback slips away from two-week highs in response to some profit-taking mood and speculation of Fed rate cuts. In addition, hawkish comments from the BoE’s Pill are also collaborating with the quid’s improvement.

Gold climbs further, focus is back to 45,000

Gold regains upside traction and surpasses the $4,900 mark per troy ounce at the end of the week, shifting its attention to the critical $5,000 region. The move reflects a shift in risk sentiment, driving flows back towards traditional safe haven assets and supporting the yellow metal.

Crypto Today: Bitcoin, Ethereum, XRP rebound amid risk-off, $2.6 billion liquidation wave

Bitcoin edges up above $65,000 at the time of writing on Friday, as dust from the recent macro-triggered sell-off settles. The leading altcoin, Ethereum, hovers above $1,900, but resistance at $2,000 caps the upside. Meanwhile, Ripple has recorded the largest intraday jump among the three assets, up over 10% to $1.35.

Three scenarios for Japanese Yen ahead of snap election

The latest polls point to a dominant win for the ruling bloc at the upcoming Japanese snap election. The larger Sanae Takaichi’s mandate, the more investors fear faster implementation of tax cuts and spending plans. 

XRP rally extends as modest ETF inflows support recovery

Ripple is accelerating its recovery, trading above $1.36 at the time of writing on Friday, as investors adjust their positions following a turbulent week in the broader crypto market. The remittance token is up over 21% from its intraday low of $1.12.