Wheat Elliott Wave technical analysis [Video]
![Wheat Elliott Wave technical analysis [Video]](https://editorial.fxstreet.com/images/Markets/Commodities/Agriculture/Wheat/wheat-field-under-clear-blue-sky-17453573_XtraLarge.jpg)
Wheat Elliott Wave analysis
Since reaching its peak in March 2022, Wheat prices have experienced a dramatic decline, plummeting nearly 61% from over 1360 to the current level of approximately 540. This significant downturn reflects a prolonged bearish cycle that has persisted for over 28 months. However, based on Elliott Wave analysis, this bearish phase appears to be approaching its conclusion, signaling the potential onset of a multi-month bullish phase. This anticipated upward movement could serve as a corrective phase, counterbalancing the extended period of selling pressure.
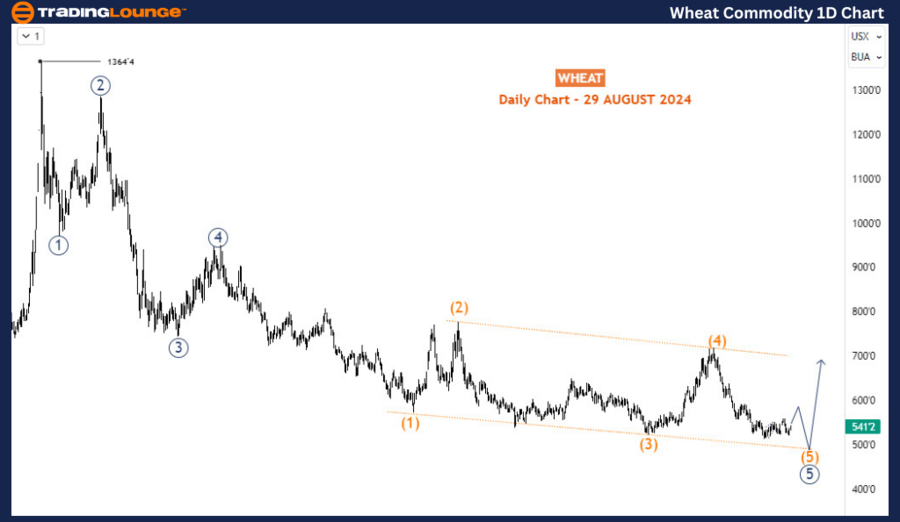
Daily chart analysis
Examining the daily chart, the downtrend from the March 2022 high of 1364 has been characterized by a well-defined impulse wave structure. This structure is now in its final stage, with the fifth wave nearing completion. The fifth wave, which began in May 2024, is currently forming what appears to be an ending diagonal pattern—a common pattern in the final stages of an impulse wave. The development of this diagonal suggests that the decline is losing momentum, and a reversal could be imminent. However, it's important to note that Wave (5) might still evolve into a three-swing structure before fully completing. This implies that while Wheat prices could dip further, potentially reaching the 500 level or slightly below, the ongoing rebound could see prices rise to the 560-590 range before the sell-off resumes. This price action would align with the typical behavior of an ending diagonal, where a final push lower is often followed by a significant corrective rally.
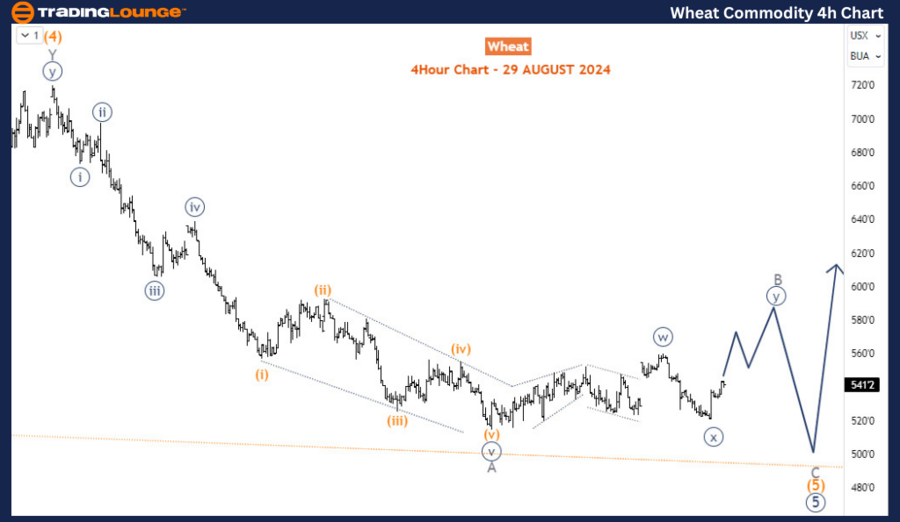
Four-hour chart analysis
The H4 chart offers a closer examination of the sub-waves within Wave (5) of the diagonal structure seen in Wave 5 (circled) on the daily chart. This wave is expected to complete a corrective three-wave structure. The initial sub-wave, Wave A, has seemingly completed a bearish impulse move from the peak in May 2024. Following this, the current bounce from the July 2024 low is identified as Wave B, which appears to be forming a corrective pattern. Early indications suggest that Wave B is developing into a double zigzag pattern, a complex correction often seen in Elliott Wave analysis. As long as the low from August 27th remains intact, Wave B could extend higher, potentially offering a short-term rally before the broader downtrend continues. This scenario underscores the importance of monitoring key support levels, as a breach of the August 27th low could invalidate the current corrective pattern and suggest further downside risk.
In summary, while the long-term downtrend in Wheat may still have room to run, the market is showing signs of nearing a significant bottom, with the potential for a multi-month bullish correction on the horizon.
Wheat Elliott Wave technical analysis [Video]
Author

Peter Mathers
TradingLounge
Peter Mathers started actively trading in 1982. He began his career at Hoei and Shoin, a Japanese futures trading company.


