Wheat Elliott Wave technical analysis [Video]
![Wheat Elliott Wave technical analysis [Video]](https://editorial.fxstreet.com/images/Markets/Commodities/Agriculture/Wheat/wheat-and-hands-of-the-old-farmer-9692257_XtraLarge.jpg)
Wheat Elliott Wave analysis
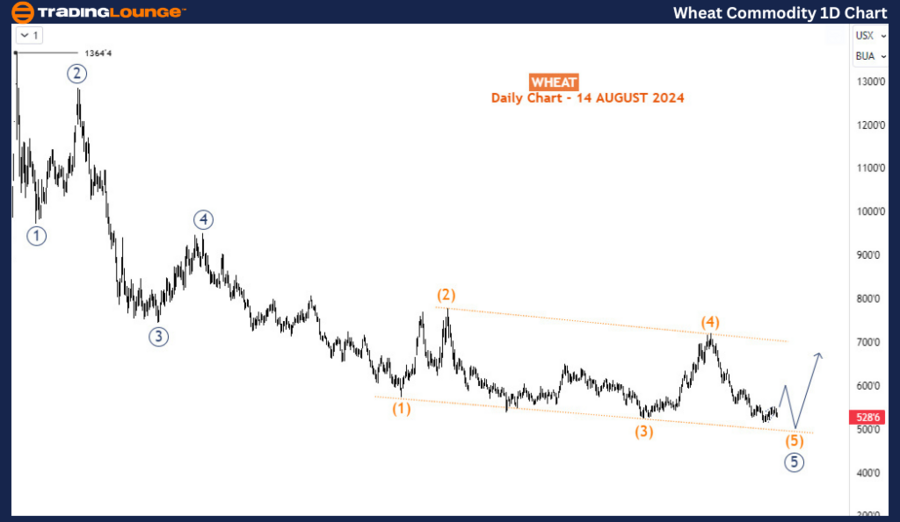
Since its peak in March 2022, Wheat prices have dropped nearly 61%, falling from over 1360 to around 530. However, this bearish cycle appears to be nearing its end, and a multi-month bullish phase may soon begin, correcting the over 28 months of sell-off.
Daily chart analysis
On the daily chart, the decline from the March 2022 peak of 1364 has been unfolding as an impulse wave structure. This structure is now in its final stage, with the 5th wave close to completing an ending diagonal pattern. Although Wheat prices could still drop to 500 or slightly below, sellers should be cautious. The coming weeks and months will likely see short positions being exited, making way for new bullish positions.
H4 chart analysis
The H4 chart shows the sub-waves of wave (5) of the diagonal wave 5 (circled) on the daily chart. Wave (5) should complete a corrective 3-wave structure. It appears wave A has been completed with a bearish impulse from the top of May 2024 and the current bounce from the low of July 2024 is for wave B correction.
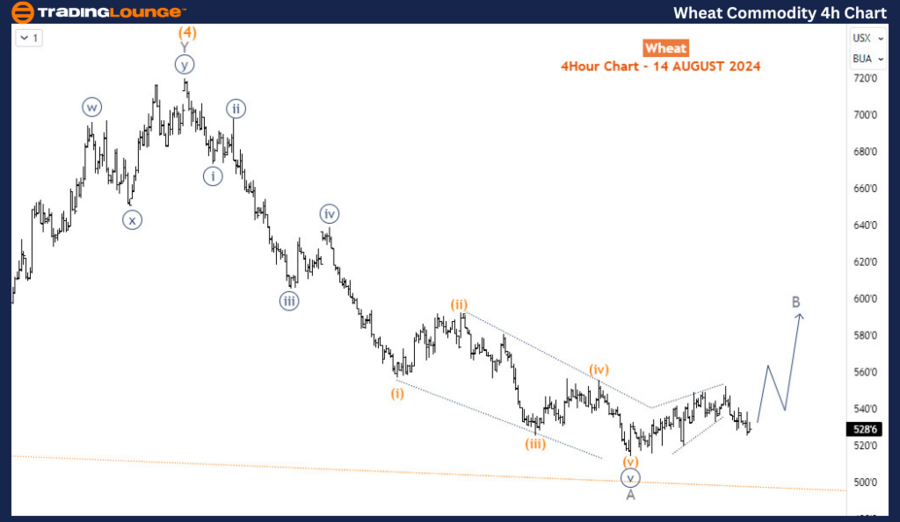
While there is still more room for the bearish trend from March 2024 below $500, it’s clear the commodity is approaching the final leg before a much bigger and longer bullish reaction than the previous bounces since 2022 began.
Technical analyst: Sanmi Adeagbo.
Wheat Elliott Wave analysis [Video]
Author

Peter Mathers
TradingLounge
Peter Mathers started actively trading in 1982. He began his career at Hoei and Shoin, a Japanese futures trading company.


