USD: Mar '25 is Up at 107.995.
Energies: Mar '25 Crude is Down at 73.32.
Financials: The Mar '25 30 Year T-Bond is Up 5 ticks and trading at 114.08.
Indices: The Mar '25 S&P 500 emini ES contract is 7 ticks Higher and trading at 6098.75.
Gold: The Feb'25 Gold contract is trading Down at 2766.70.
Initial conclusion
This is not a correlated market. The USD is Up and Crude is Down which is normal, and the 30 Year T-Bond is trading Higher. The Financials should always correlate with the US dollar such that if the dollar is Higher, then the bonds should follow and vice-versa. The S&P is Higher and Crude is trading Lower which is correlated. Gold is trading Lower which is correlated with the US dollar trading Up. I tend to believe that Gold has an inverse relationship with the US Dollar as when the US Dollar is down, Gold tends to rise in value and vice-versa. Think of it as a seesaw, when one is up the other should be down. I point this out to you to make you aware that when we don't have a correlated market, it means something is wrong. As traders you need to be aware of this and proceed with your eyes wide open. Asia traded Mainly Higher with the exception of the Shanghai exchange which is fractionally Lower. All of Europe is trading Higher with the exception of the Paris exchange.
Possible challenges to traders
-
Goods Trade Balance is out at 8:30 AM EST. This is Major.
-
Prelim Wholesale Inventories m/m is out at 8:30 AM EST. This is Major.
-
Crude Oil Inventories is out at 10:30 AM EST. This is Major.
-
Federal Funds Rate is out at 2 PM EST. This is Major.
-
FOMC Statement is out at 2 PM EST. This is Major.
-
FOMC Press Conference starts at 2:30 PM EST. This is Major.
Traders, please note that we've changed the Bond instrument from the 10 year (ZN) to the 2 year (ZT). They work exactly the same.
We've elected to switch gears a bit and show correlation between the 2-year Treasury notes (ZT) and the S&P futures contract. The YM contract is the Dow Jones Industrial Average, and the purpose is to show reverse correlation between the two instruments. Remember it's likened to a seesaw, when up goes up the other should go down and vice versa.
Yesterday the ZT migrated Higher at around 8:30 AM EST as the Durable Goods numbers were being reported. The Dow moved Lower at the same time. Look at the charts below and you'll see a pattern for both assets. The Dow moved Lower at 8:30 AM EST and the ZT moved Higher at around the same time. These charts represent the newest version of Bar Charts, and I've changed the timeframe to a 15-minute chart to display better. This represented a Long opportunity on the 2-year note, as a trader you could have netted about a dozen plus ticks per contract on this trade. Each tick is worth $7.625. Please note: the front month for ZT is now Mar '25 and the Dow is now Mar '25. I've changed the format to filled Candlesticks (not hollow) such that it may be more apparent and visible.
Charts courtesy of barcharts
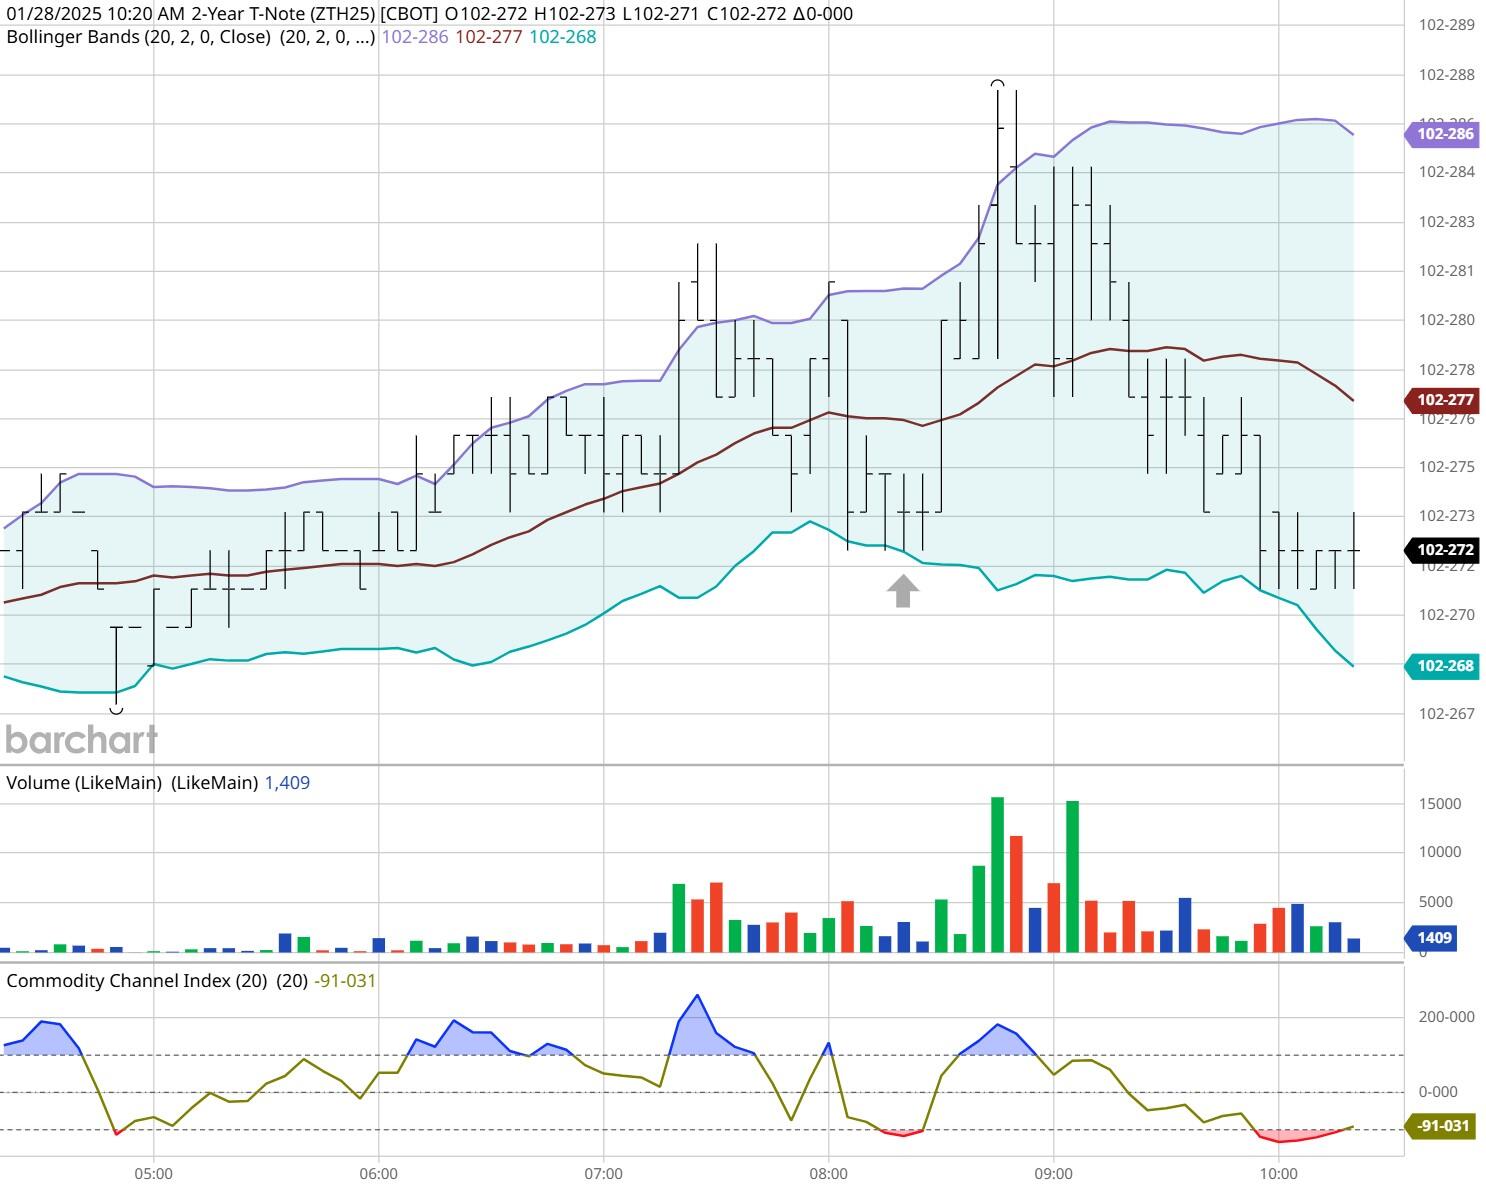
ZT -Mar 2025 - 1/28/25
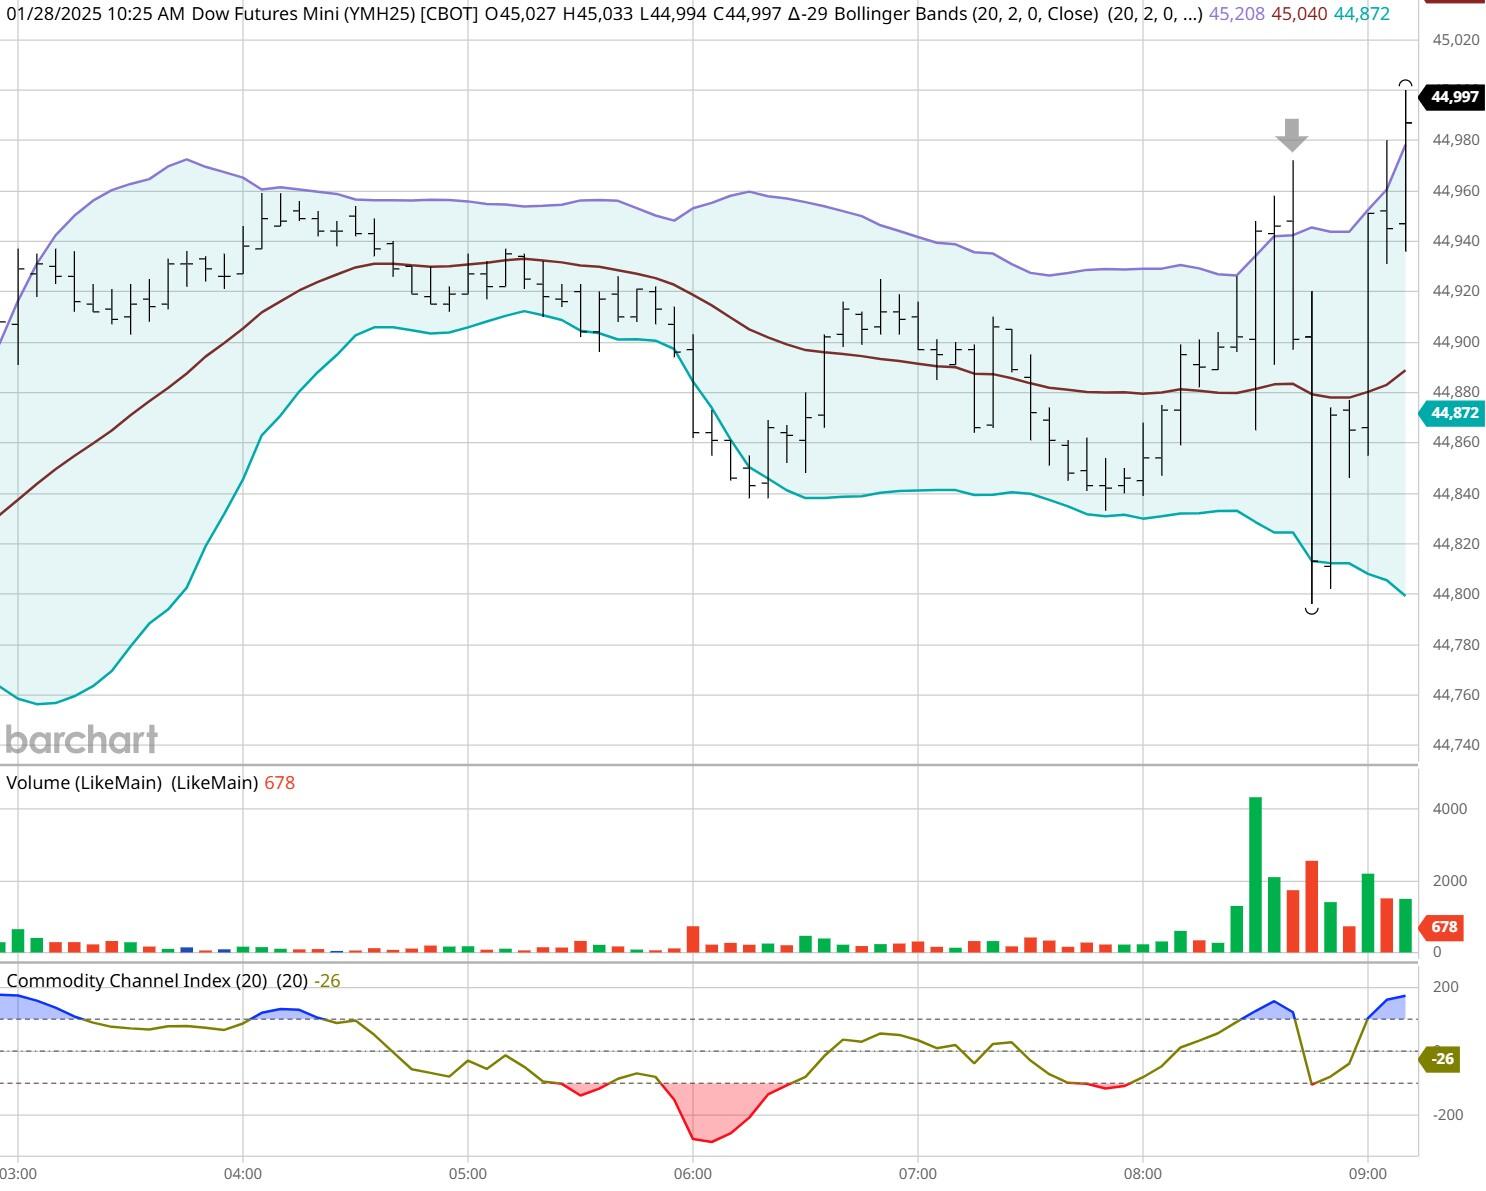
Dow - Mar 2025- 1/28/25
Bias
Yesterday we gave the markets a Neutral or Mixed bias, but the markets migrated to the Upside. The Dow gained 137 points, and the other indices gained ground as well. Given that today is FOMC Day our bias is Neutral or Mixed.
Could this change? Of Course. Remember anything can happen in a volatile market.
Commentary
Today marks the first FOMC Day for 2025 and the question on everyone's mind is what will the Federal Reserve do? Some think the Fed will cut rates by a quarter point or 25 basis points. Yet others think the Fed will either raise or hold rates as they are neither receding nor raising. In this regard I can't determine what the Federal Reserve will do. It wouldn't surprise me if Trump tried to override what the Federal Reserve will decide if he doesn't like the call made. Want to learn Market Correlation and determine market direction hours before the Opening Bell?
Trading performance displayed herein is hypothetical. The following Commodity Futures Trading Commission (CFTC) disclaimer should be noted.
Hypothetical performance results have many inherent limitations, some of which are described below. No representation is being made that any account will or is likely to achieve profits or losses similar to those shown.
In fact, there are frequently sharp differences between hypothetical performance results and the actual results subsequently achieved by any particular trading program. One of the limitations of hypothetical performance trading results is that they are generally prepared with the benefit of hindsight.
In addition, hypothetical trading does not involve financial risk, and no hypothetical trading record can completely account for the impact of financial risk in actual trading. For example, the ability to withstand losses or to adhere to a particular trading program in spite of trading losses are material points which can also adversely affect actual trading results.
There are numerous other factors related to the markets in general or to the implementation of any specific trading program which cannot be fully accounted for in the preparation of hypothetical performance results and all of which can adversely affect actual trading results.
Trading in the commodities markets involves substantial risk and YOU CAN LOSE A LOT OF MONEY, and thus is not appropriate for everyone. You should carefully consider your financial condition before trading in these markets, and only risk capital should be used.
In addition, these markets are often liquid, making it difficult to execute orders at desired prices. Also, during periods of extreme volatility, trading in these markets may be halted due to so-called “circuit breakers” put in place by the CME to alleviate such volatility. In the event of a trading halt, it may be difficult or impossible to exit a losing position.
Recommended Content
Editors’ Picks
![EUR/USD hits two-week tops near 1.0500 on poor US Retail Sales](https://editorial.fxsstatic.com/images/i/EURUSD-neutral-line_Medium.png)
EUR/USD hits two-week tops near 1.0500 on poor US Retail Sales
The selling pressure continues to hurt the US Dollar and now encourages EUR/USD to advance to new two-week peaks in levels just shy of the 1.0500 barrier in the wake of disappointing results from US Retail Sales.
![GBP/USD surpasses 1.2600 on weaker US Dollar](https://editorial.fxsstatic.com/images/i/GBPUSD-neutral-object-1_Medium.png)
GBP/USD surpasses 1.2600 on weaker US Dollar
GBP/USD extends its march north and reclaims the 1.2600 hurdle for the first time since December on the back of the increasing downward bias in the Greenback, particularly exacerbated following disheartening US results.
![Gold maintains the bid tone near $2,940](https://editorial.fxsstatic.com/images/i/Commodities_Gold-2_Medium.jpg)
Gold maintains the bid tone near $2,940
The continuation of the offered stance in the Greenback coupled with declining US yields across the board underpin the extra rebound in Gold prices, which trade at shouting distance from their record highs.
![Weekly wrap: XRP, Solana and Dogecoin lead altcoin gains on Friday](https://editorial.fxsstatic.com/images/i/DOGE-neutral-object_Medium.png)
Weekly wrap: XRP, Solana and Dogecoin lead altcoin gains on Friday
XRP, Solana (SOL) and Dogecoin (DOGE) gained 5.91%, 2.88% and 3.36% respectively on Friday. While Bitcoin (BTC) hovers around the $97,000 level, the three altcoins pave the way for recovery and rally in altcoins ranking within the top 50 cryptocurrencies by market capitalization on CoinGecko.
![Tariffs likely to impart a modest stagflationary hit to the economy this year](https://editorial.fxsstatic.com/images/i/Economic-Indicator_GDP-3_Medium.png)
Tariffs likely to impart a modest stagflationary hit to the economy this year
The economic policies of the Trump administration are starting to take shape. President Trump has already announced the imposition of tariffs on some of America's trading partners, and we assume there will be more levies, which will be matched by foreign retaliation, in the coming quarters.
![The Best Brokers of the Year](https://editorial.fxsstatic.com/images/Brokers/Editors_Pick_Box_395x179_Medium.png)
The Best Brokers of the Year
SPONSORED Explore top-quality choices worldwide and locally. Compare key features like spreads, leverage, and platforms. Find the right broker for your needs, whether trading CFDs, Forex pairs like EUR/USD, or commodities like Gold.