What the USDX shows will happen to oil soon

Less than a month from now – on December 5 – an embargo on maritime exports of Russian crude oil to the European Union will come into force, as I explained in my last article.
As a result, global oil supply is expected to tighten significantly, with Russia being the world’s largest exporter of oil and fuels.
Therefore, energy markets are bracing for turbulence, as they may face a new storm of volatility.
On the macroeconomic view, the US Dollar Currency Index – still weakening against a basket of major currencies – starts looking down from the balcony to revisit some lower floors:
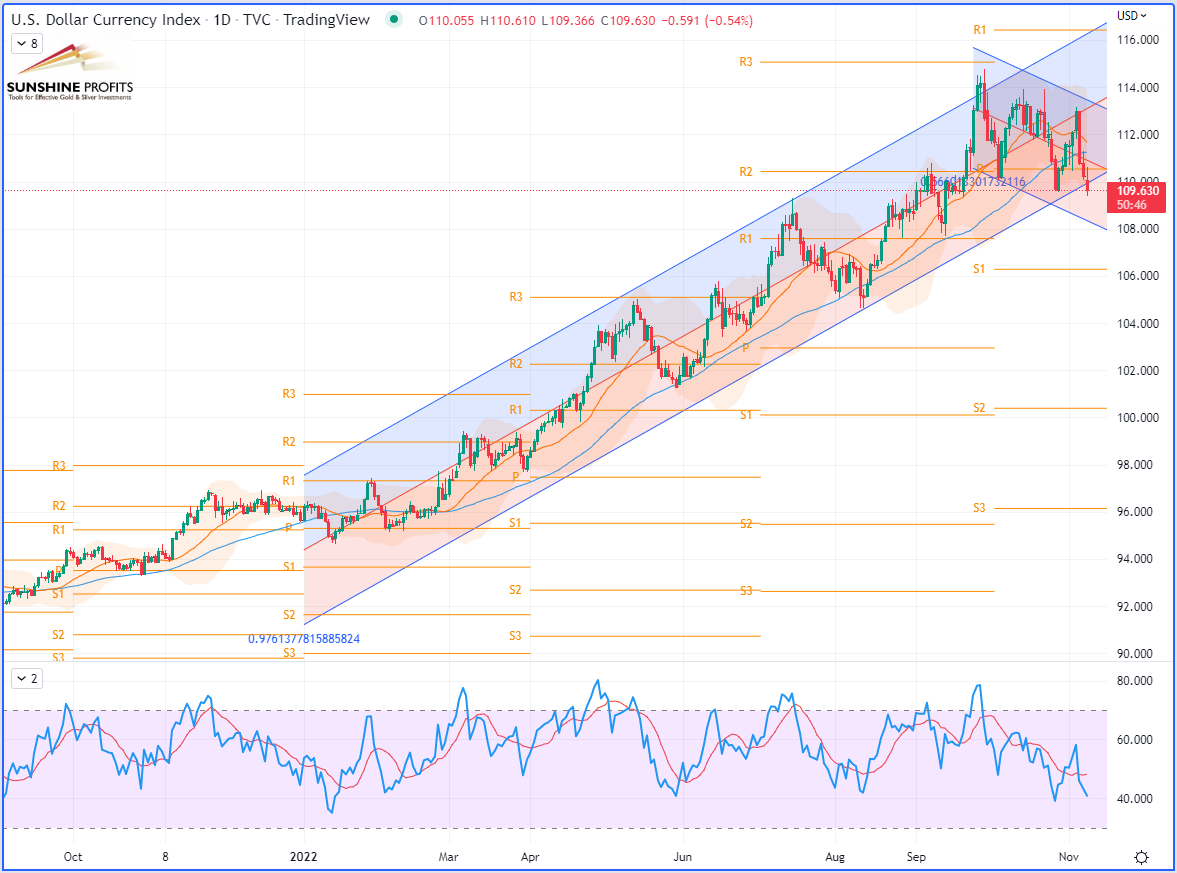
US Dollar Curency Index – 2021-2022 (zoomed out)
While currently moving slightly outside the lower band of the 2022 regression channel, its previous swing low from October has just been taken over as the DXY is now progressing within a newly forming downward regression channel starting from the end of the last quarter.
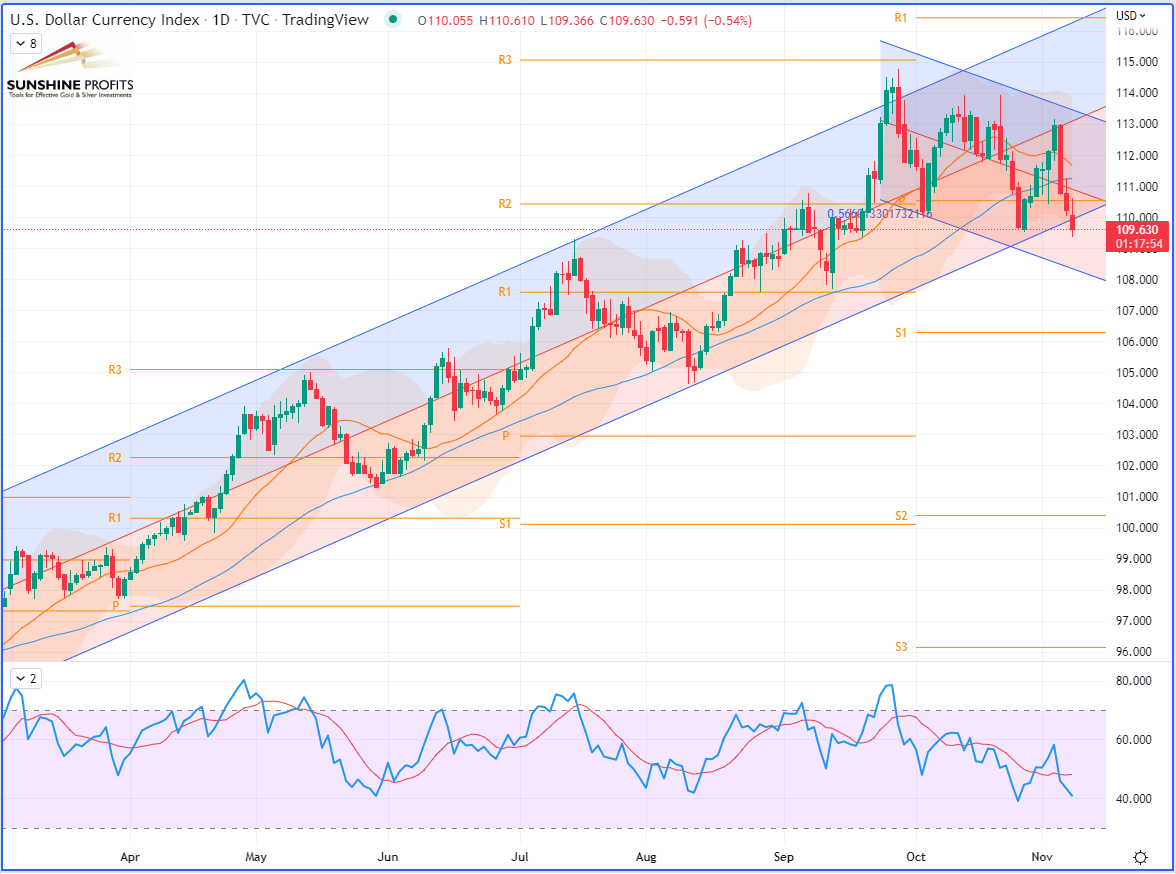
US Dollar Currency Index (DXY) CFD (daily chart) for 2022 (zoomed in)
Let’s zoom into a 4H chart to get a larger picture:
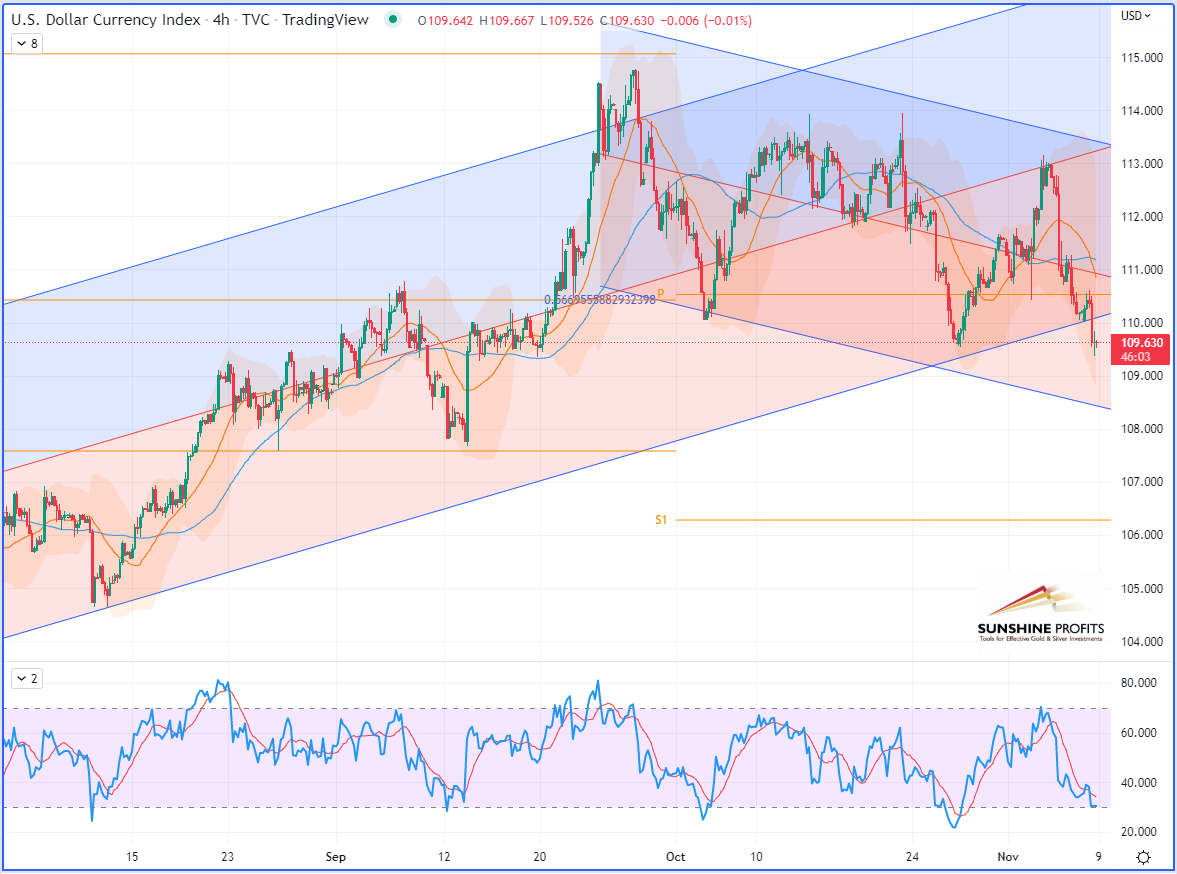
US Dollar Currency Index (DXY) CFD (4H chart)
Here is the big picture for the WTI Crude Oil chart, after zooming out over the weekly timeframe:
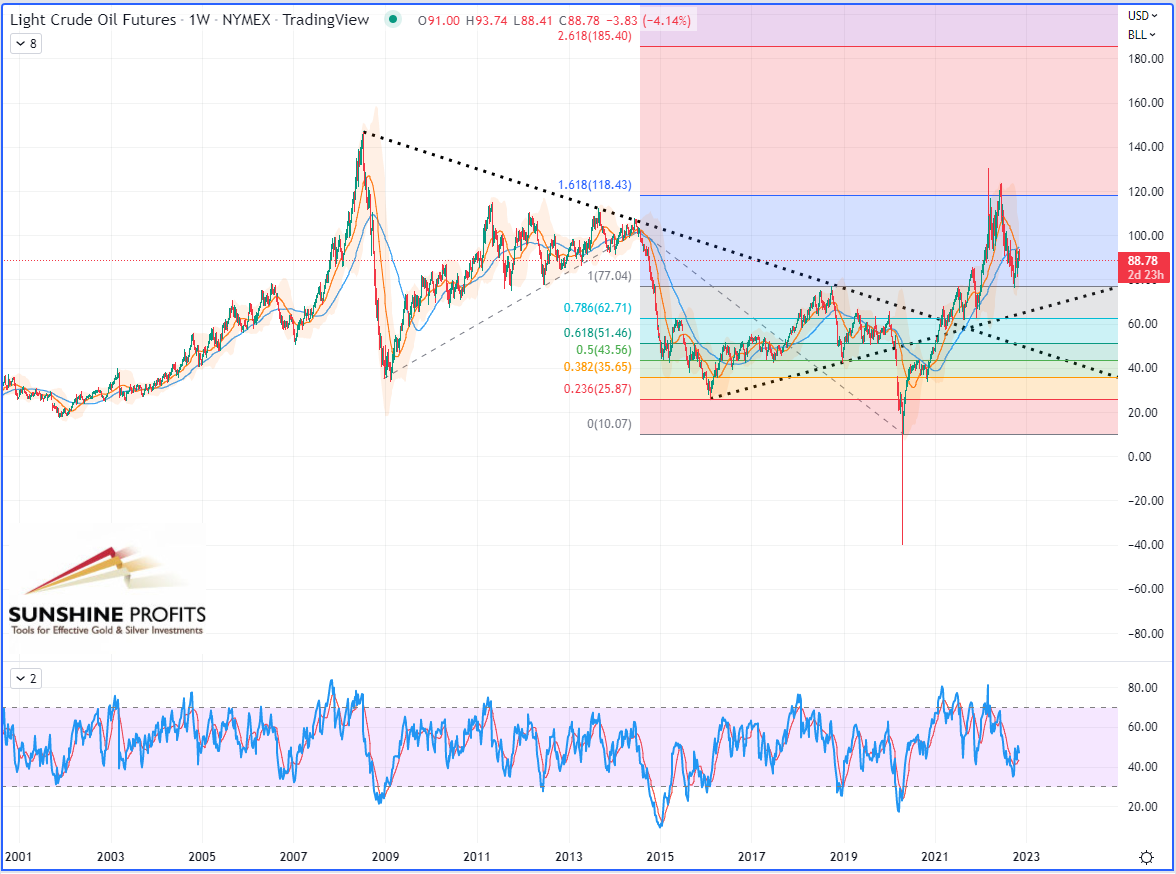
WTI Crude Oil (CL) Futures (Continuous, weekly chart)
The long-term structure looks rather bullish for the black gold – with an upward trend that could be triggered as the greenback may start to explore lower floors.
At the moment, if we consider the past two sessions this week alone, both assets are correlated rather positively (both falling at the same time).
But this short-term correlation may start to turn negative if we see further weakening on the US dollar, which would have the effect of propelling commodities, starting with energy. But gold can also benefit from this, as investors may switch to the yellow metal as a new safe-haven.
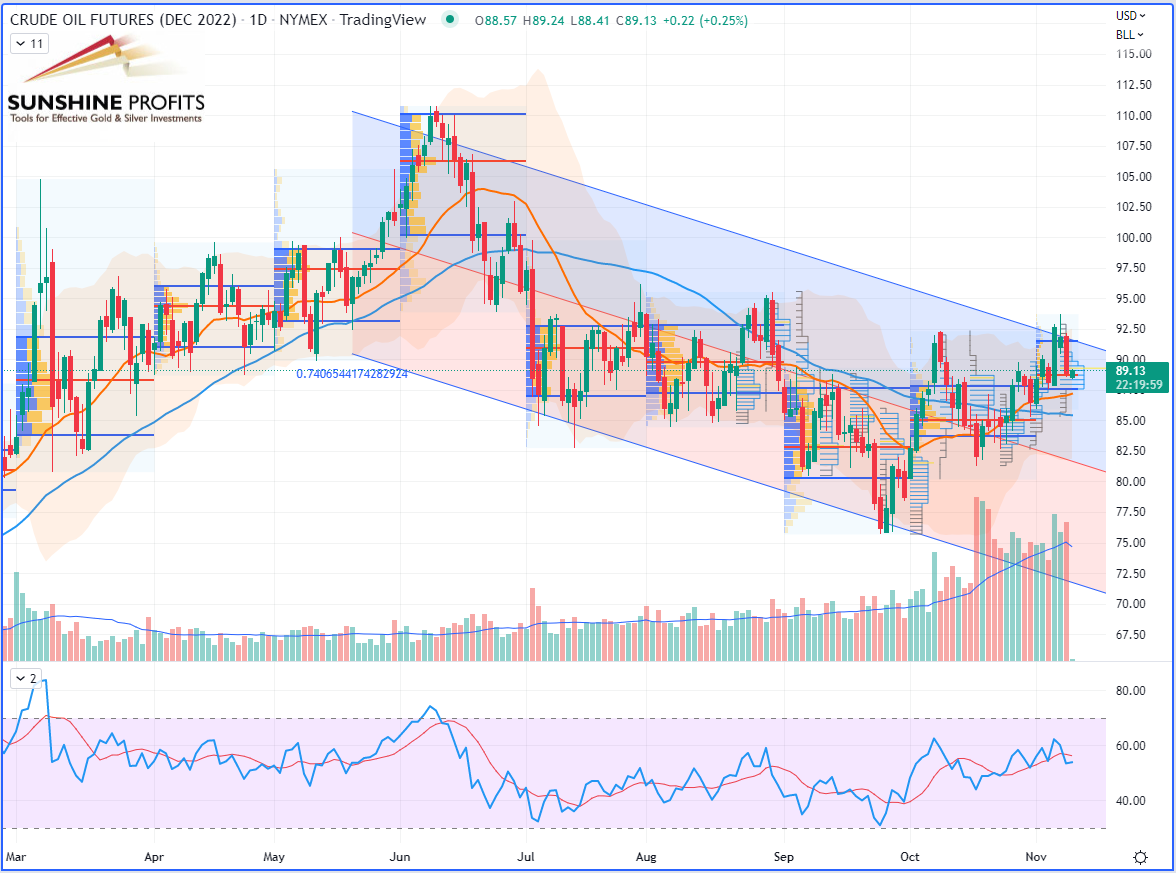
WTI Crude Oil (CLZ22) Futures (December contract, daily chart)
If oil prices fell on Tuesday (Nov 8th), it was mainly because they were weighed down by disappointing indicators in China and a resurgence of the epidemic which threatens demand in the country, one of the engines of global demand.
Demand in China – the country that imports the most crude in the world and also the second consumer of oil (after the United States) – is particularly unstable since the health authorities assured that the strict zero-Covid health policy would continue to be applied.
Moreover, as financial market players are increasingly concerned about the state of the global economy, the latest commercial data from China, which also highlighted a significant slowdown, seems to have proven them right.
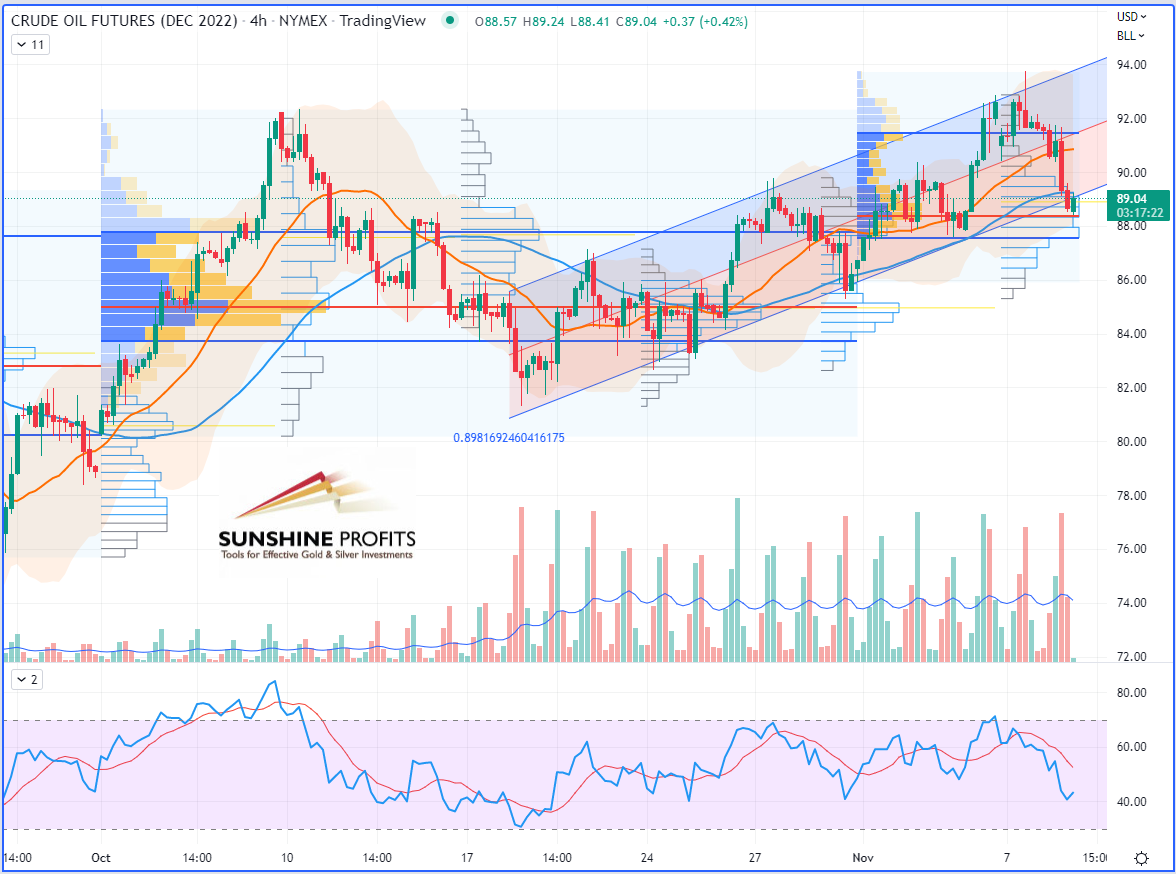
WTI Crude Oil (CLZ22) Futures (December contract, 4H chart)
Want free follow-ups to the above article and details not available to 99%+ investors? Sign up to our free newsletter today!
Author

Sébastien Bischeri
Sunshine Profits
Sebastien Bischeri is a former Reserve Officer in the French Armed Forces (Navy), and began his career in computer science and engineering, prior to move into banking, finance, and trading.


