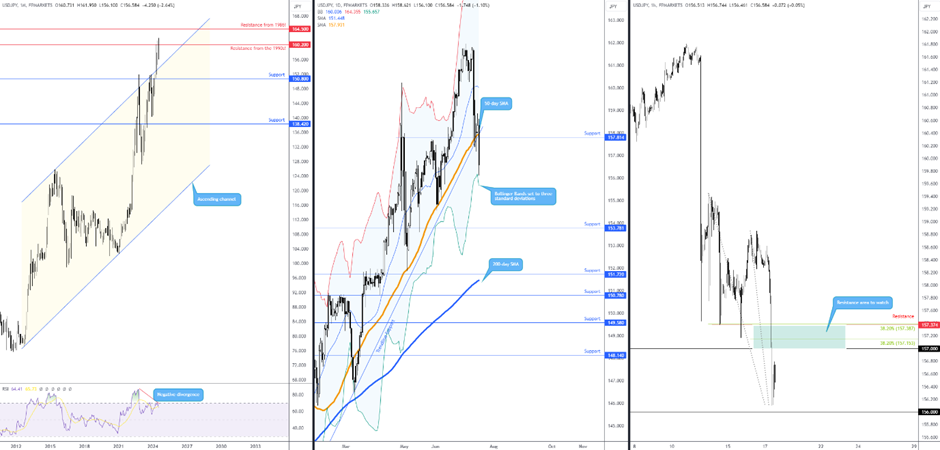
Down -2.7% month to date, July has erased June’s upside move (+2.3%) and is on track to potentially form a monthly outside reversal candle from resistance at ¥160.20, a level drawn from as far back as the 1990s. The selling is likely due to increased expectations of a Fed rate cut in September and an unwind in carry trades.

Monthly chart demonstrating scope to explore lower

Technically speaking, support calls for attention on the monthly chart at approximately ¥154.60, a channel resistance-turned-potential support line drawn from the high of ¥125.85. A break beyond here would pave the way for monthly support at ¥150.80. Adding to the bearish picture on the monthly timeframe is the Relative Strength Index (RSI), which is chalking up early negative divergence out of overbought territory.

The monthly chart, therefore, signals further selling could be on the table for the currency pair.

Daily support engulfed

Meanwhile, on the daily timeframe, today’s push south (down -1.1% as of writing) absorbed bids from support at ¥157.81, as well as trendline support extended from the low of ¥140.25, and the 50-day simple moving average (SMA) at ¥157.93. However, before sellers can venture towards daily support coming in at ¥153.78, the possibility of dynamic support exists nearby in the form of the lower Bollinger Band at ¥155.72, set to three standard deviations (default usually set to two standard deviations).

H1 resistance deserves attention

Shorter-term flow on the H1 timeframe reveals price action came within a whisker of greeting the ¥156.00 handle mid-way through London before moderately recoiling higher. With the US cash open now upon us, resistance between ¥157.39 and the ¥157.00 big figure might be watched for possible bearish scenarios (note that the area also houses two 38.2% Fibonacci retracement ratios).

So, although the longer-term trend is to the upside, a bearish play could be in the offing. With the monthly chart showing room to press south until ¥154.60, and daily flow yet to bump heads with the lower Bollinger Band, the H1 resistance between ¥157.39 and ¥157.00 may be a location that sellers welcome, targeting ¥156.00 and possibly beyond.

Chart

This material on this website is intended for illustrative purposes and general information only. It does not constitute financial advice nor does it take into account your investment objectives, financial situation or particular needs. Commission, interest, platform fees, dividends, variation margin and other fees and charges may apply to financial products or services available from FP Markets. The information in this website has been prepared without taking into account your personal objectives, financial situation or needs. You should consider the information in light of your objectives, financial situation and needs before making any decision about whether to acquire or dispose of any financial product. Contracts for Difference (CFDs) are derivatives and can be risky; losses can exceed your initial payment and you must be able to meet all margin calls as soon as they are made. When trading CFDs you do not own or have any rights to the CFDs underlying assets.

FP Markets recommends that you seek independent advice from an appropriately qualified person before deciding to invest in or dispose of a derivative. A Product Disclosure Statement for each of the financial products is available from FP Markets can be obtained either from this website or on request from our offices and should be considered before entering into transactions with us. First Prudential Markets Pty Ltd (ABN 16 112 600 281, AFS Licence No. 286354).

Recommended Content


Recommended Content

Editors’ Picks

EUR/USD clings to strong daily gains above 1.0900

EUR/USD clings to strong daily gains above 1.0900

EUR/USD stays in positive territory despite retreating from the multi-month high it set near 1.0950 earlier in the day. The broad-based selling pressure surrounding the US Dollar, despite the upbeat housing data, helps the pair preserve its bullish momentum.

EUR/USD News

GBP/USD pulls away from 2024-highs, holds above 1.3000

GBP/USD pulls away from 2024-highs, holds above 1.3000

GBP/USD continues to trade in the green above 1.3000 after pulling away from the 2024-high it touched in the European session with the immediate reaction to UK inflation data. The negative shift seen in risk mood limits the pair's upside in the second half of the day.

GBP/USD News

USD/JPY tumbles to 156.00 amid risk-aversion, technical breakdown

USD/JPY tumbles to 156.00 amid risk-aversion, technical breakdown

USD/JPY is off the lows but under heavy selling pressure on the 156.00 level in European trading on Wednesday. Souring risk sentiment and a technical breakdown has fuelled the USD/JPY meltdown, as Japanese intervention risks loom. 

USD/JPY News

Gold declines below $2,470 following record-setting rally

Gold declines below $2,470 following record-setting rally

Gold trades flat on the day below $2,470 after touching a new record high above $2,480 in the Asian session on Wednesday. The modest recovery seen in the US Treasury bond yields causes XAU/USD to consolidate its gains.

Gold News

Bitcoin rally catalyzes gains in Ethereum, Solana, and XRP, as traders digest Donald Trump incident

Bitcoin rally catalyzes gains in Ethereum, Solana, and XRP, as traders digest Donald Trump incident

Crypto market capitalization increased nearly 4% in the last 24 hours and climbed to $2.522 trillion on Wednesday, as seen on CoinGecko. Almost all cryptocurrencies ranked in the top 10 assets by market capitalization have rallied in that period.

Read more

Majors

Cryptocurrencies

Signatures