What goes up, must come down

USD: Mar '25 is Down at 107.605.
Energies: Feb '25 Crude is Up at 70.76.
Financials: The Mar '25 30 Year T-Bond is Up 7 ticks and trading at 113.16.
Indices: The Mar '25 S&P 500 emini ES contract is 58 ticks Lower and trading at 6012.50.
Gold: The Feb'25 Gold contract is trading Down at 2630.20.
Initial conclusion
This is not a correlated market. The USD is Down and Crude is Up which is normal, but the 30 Year T-Bond is trading Higher. The Financials should always correlate with the US dollar such that if the dollar is Higher, then the bonds should follow and vice-versa. The S&P is Lower and Crude is trading Higher which is correlated. Gold is trading Lower which is not correlated with the US dollar trading Down. I tend to believe that Gold has an inverse relationship with the US Dollar as when the US Dollar is down, Gold tends to rise in value and vice-versa. Think of it as a seesaw, when one is up the other should be down. I point this out to you to make you aware that when we don't have a correlated market, it means something is wrong. As traders you need to be aware of this and proceed with your eyes wide open. Asia traded mainly Higher with the exception of the Shanghai and Singapore exchanges. Europe is trading Mixed.
Possible challenges to traders
-
Chicago PMI is out at 9:45 AM EST. This is Major.
-
Pending Home Sales is out at 10 AM EST. This is Major.
Traders, please note that we've changed the Bond instrument from the 10 year (ZN) to the 2 year (ZT). They work exactly the same.
We've elected to switch gears a bit and show correlation between the 2-year Treasury notes (ZT) and the S&P futures contract. The YM contract is the Dow Jones Industrial Average, and the purpose is to show reverse correlation between the two instruments. Remember it's likened to a seesaw, when up goes up the other should go down and vice versa.
On Friday the ZT migrated Higher at around 7 AM EST with no news in sight. The Dow dived Lower at the same time. Look at the charts below and you'll see a pattern for both assets. The Dow moved Lower at 7 AM EST and the ZT moved Higher at around the same time. These charts represent the newest version of Bar Charts, and I've changed the timeframe to a 15-minute chart to display better. This represented a Long opportunity on the 2-year note, as a trader you could have netted about 20 plus ticks per contract on this trade. Each tick is worth $7.625. Please note: the front month for ZT is now Mar '25 and the Dow is now Mar '25. I've changed the format to filled Candlesticks (not hollow) such that it may be more apparent and visible.
Charts courtesy of BarCharts
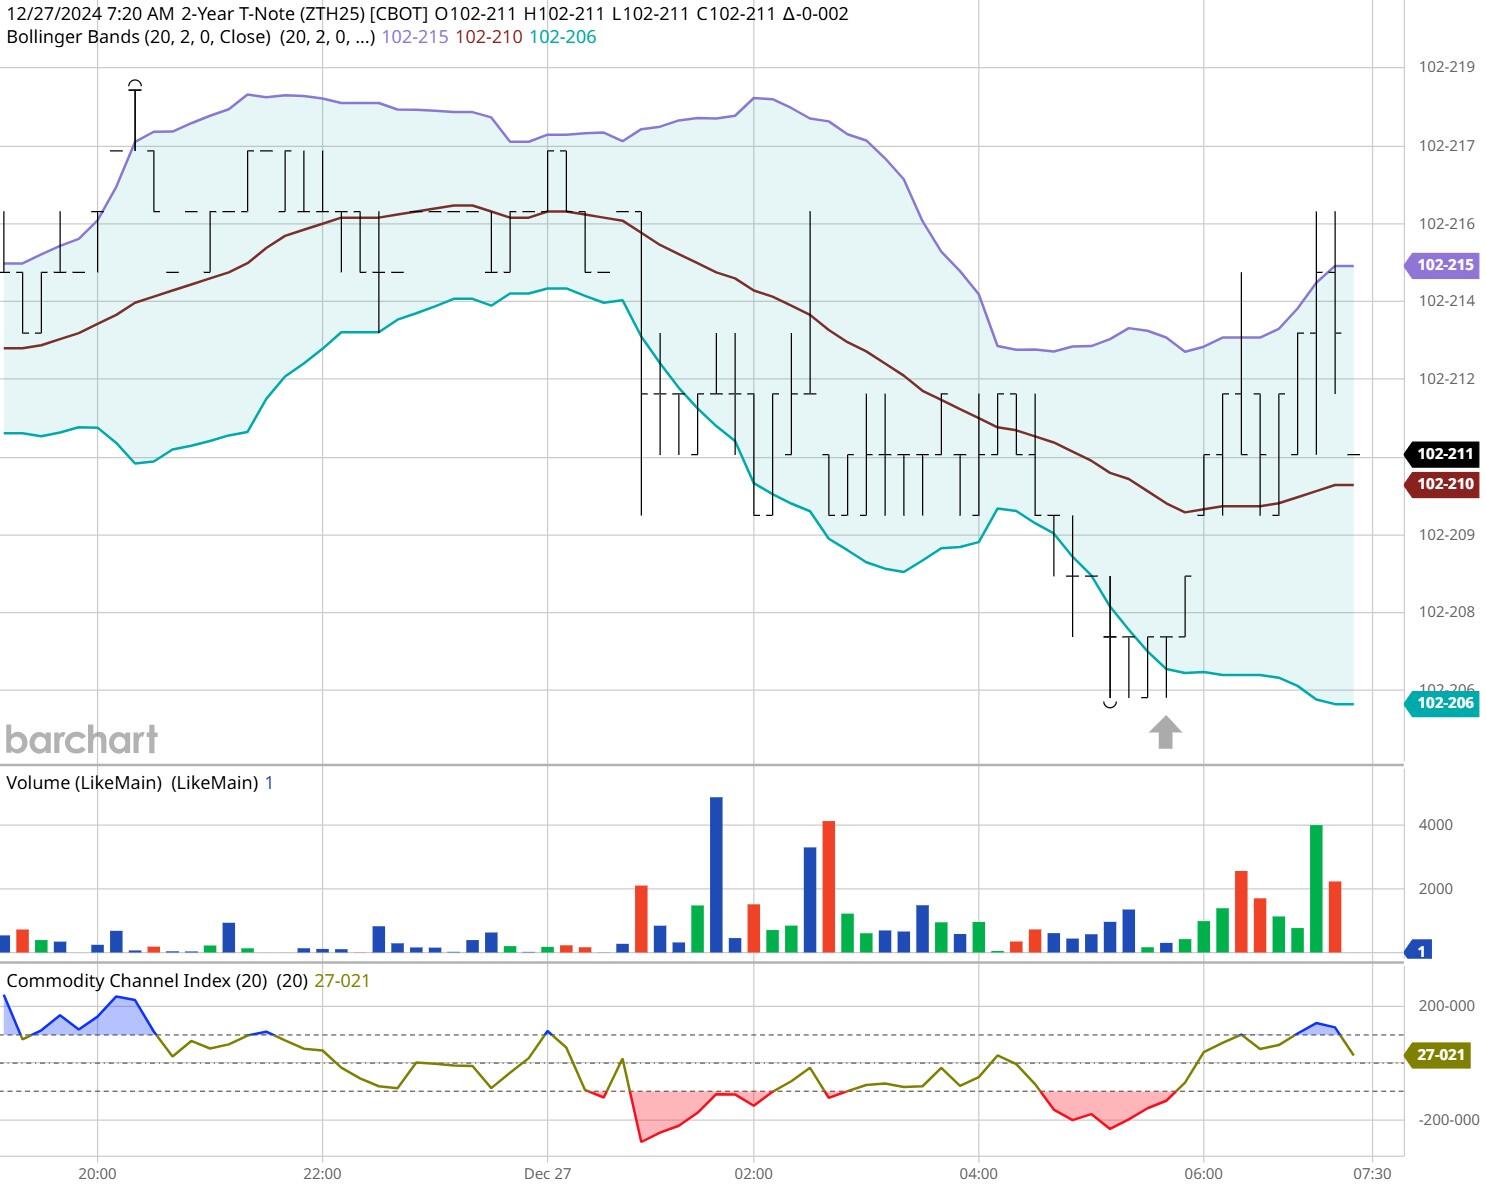
ZT -Mar 2025 - 12/27/24
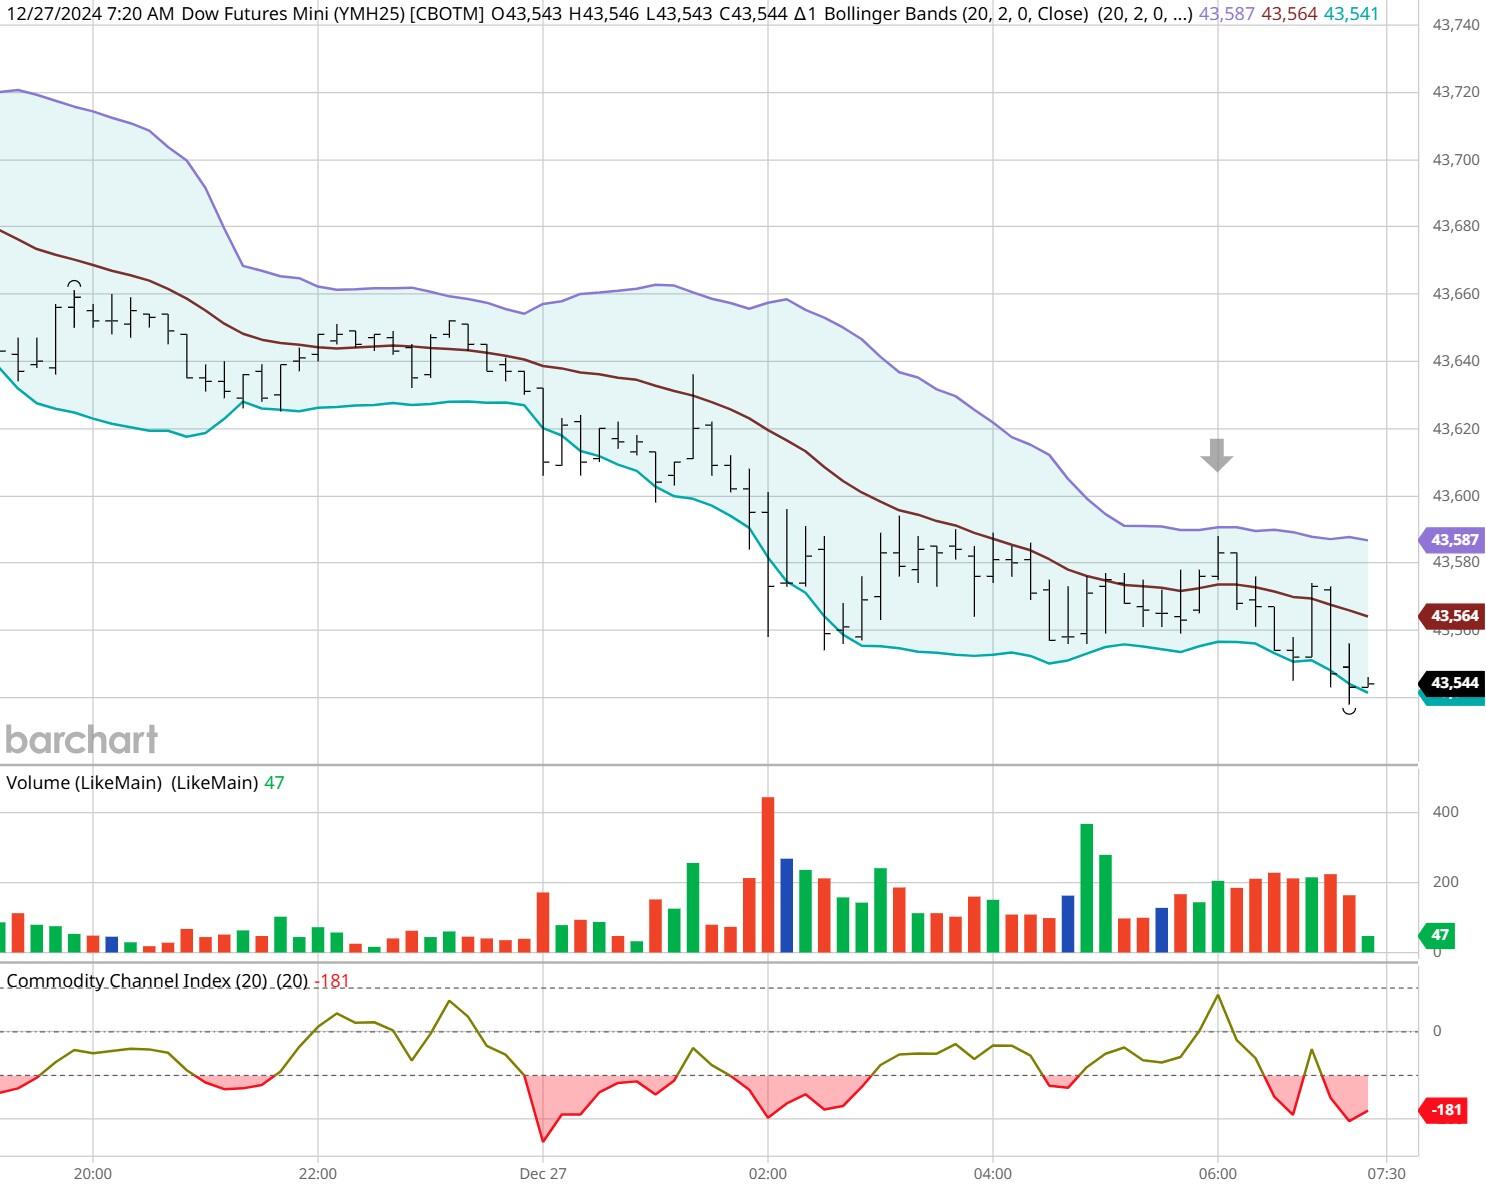
Dow - Mar 2025- 12/27/24
Bias
On Friday we gave the markets a Neutral or Mixed bias but the markets veered Lower. The Dow closed Lower by 334 points, and the other indices closed Lower as well. Today we aren't dealing with a correlated market, and our bias is to the Downside.
Could this change? Of Course. Remember anything can happen in a volatile market.
Commentary
This past Friday we gave the markets a Neutral bias which means the markets could go anywhere in any direction. The markets veered Lower, I suspect as a way of shorting the market and making profits accordingly. This week as last week we have a shortened holiday week, and it appears as though the Santa rally has fizzled out. We should however be concerned if Mr. Grinch shows up, but of course that is yet to be seen. Tomorrow is an abbreviated session, but we will have an edition for the 31st.
Author

Nick Mastrandrea
Market Tea Leaves


