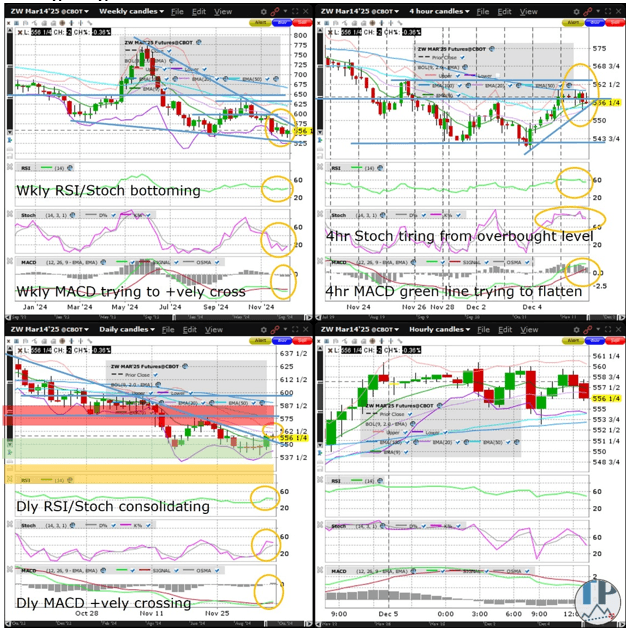
Wheat (ZW) formed a daily Doji Friday (on the March contract) just above the daily chart downtrend resistance. Nevertheless, ZW remains vulnerable to perhaps one final extension lower to the weekly chart descending wedge support following Tuesday’s highly anticipated WASDE. Regardless of whatever post-WASDE downside, ZW’s weekly chart descending wedge is nearing completion, offsetting some bearishness from last week’s fresh 2024 low (on the continuous monthly chart on tradingview.com) and lower December low versus the November low.
For now, ZW’s rallies will likely remain bear rallies until it can reclaim on a weekly basis, the October high. Until then, ZW is at moderate risk by Q1 sometime of sliding further to the 2019 low and even 2016 lows (as hinted by the still downsloping MACD on the continuous 3 month chart on tradingview.com). The weekly and daily RSI, Stochastics and MACD are bottomish, rallying or consolidating recent gains. I am looking to go long in the green zone (of the daily chart), targeting the red zone for Friday. The amber/yellow zone is where I might place a stop if I was a swing trader (although in my personal account with which I seldom hold overnight I sometimes set my stops tighter).
This communication is issued by Tradable Patterns and/or affiliates of Tradable Patterns. This is not a personal recommendation, nor an offer to buy or sell nor a solicitation to buy or sell any securities, investment products or other financial instruments or services. This material is distributed for general informational and educational purposes only and is not intended to constitute legal, tax, accounting or investment advice. The statements in this document shall not be considered as an objective or independent explanation of the matters. Please note that this document (a) has not been prepared in accordance with legal requirements designed to promote the independence of investment research, and (b) is not subject to any prohibition on dealing ahead of the dissemination or publication of investment research. Tradable Patterns 2024. All rights reserved. Intended for recipient only and not for further distribution without the consent of Tradable Patterns.
Recommended Content
Editors’ Picks
EUR/USD trades deep in red below 1.0300 after strong US jobs report
EUR/USD stays under bearish pressure and trades below 1.0300 in the American session on Friday. The US Dollar benefits from the upbeat jobs report, which showed an increase of 256,000 in Nonfarm Payrolls, and forces the pair to stay on the back foot heading into the weekend.
GBP/USD drops toward 1.2200 on broad USD demand
GBP/USD extends its weekly slide and trades at its weakest level since November 2023 below 1.2250. The data from the US showed that Nonfarm Payrolls rose by 256,000 in December, fuelling a US Dollar rally and weighing on the pair.
Gold ignores upbeat US data, approaches $2,700
Following a drop toward $2,660 with the immediate reaction to strong US employment data for December, Gold regained its traction and climbed towards $2,700. The risk-averse market atmosphere seems to be supporting XAU/USD despite renewed USD strength.
Sui bulls eyes for a new all-time high of $6.35
Sui price recovers most of its weekly losses and trades around $5.06 at the time of writing on Friday. On-chain metrics hint at a rally ahead as SUI’s long-to-short ratio reaches the highest level in over a month, and open interest is also rising.
Think ahead: Mixed inflation data
Core CPI data from the US next week could ease concerns about prolonged elevated inflation while in Central and Eastern Europe, inflation readings look set to remain high.
Best Forex Brokers with Low Spreads
VERIFIED Low spreads are crucial for reducing trading costs. Explore top Forex brokers offering competitive spreads and high leverage. Compare options for EUR/USD, GBP/USD, USD/JPY, and Gold.