Weekly Waves: EURUSD, Bitcoin and Gold
-
The EURUSD made a very strong bullish swing last week. Price made a bullish bounce at 0.9950 and rallied 400 pips to reach 1.0350.
-
Bitcoin (BTCUSD) broke below the support trend lines (dotted green) after moving sideways at the 78.6% Fibonacci support level for a couple of months.
-
Gold (XAUUSD) is moving up higher within a bullish trend channel after creating a double bottom chart pattern on the 4 hour and daily charts.

Our weekly Elliott Wave analysis reviews the EURUSD daily chart, the XAUUSD 1 hour chart, and the Bitcoin weekly chart.
EUR/USD bullish 400 pips price rally
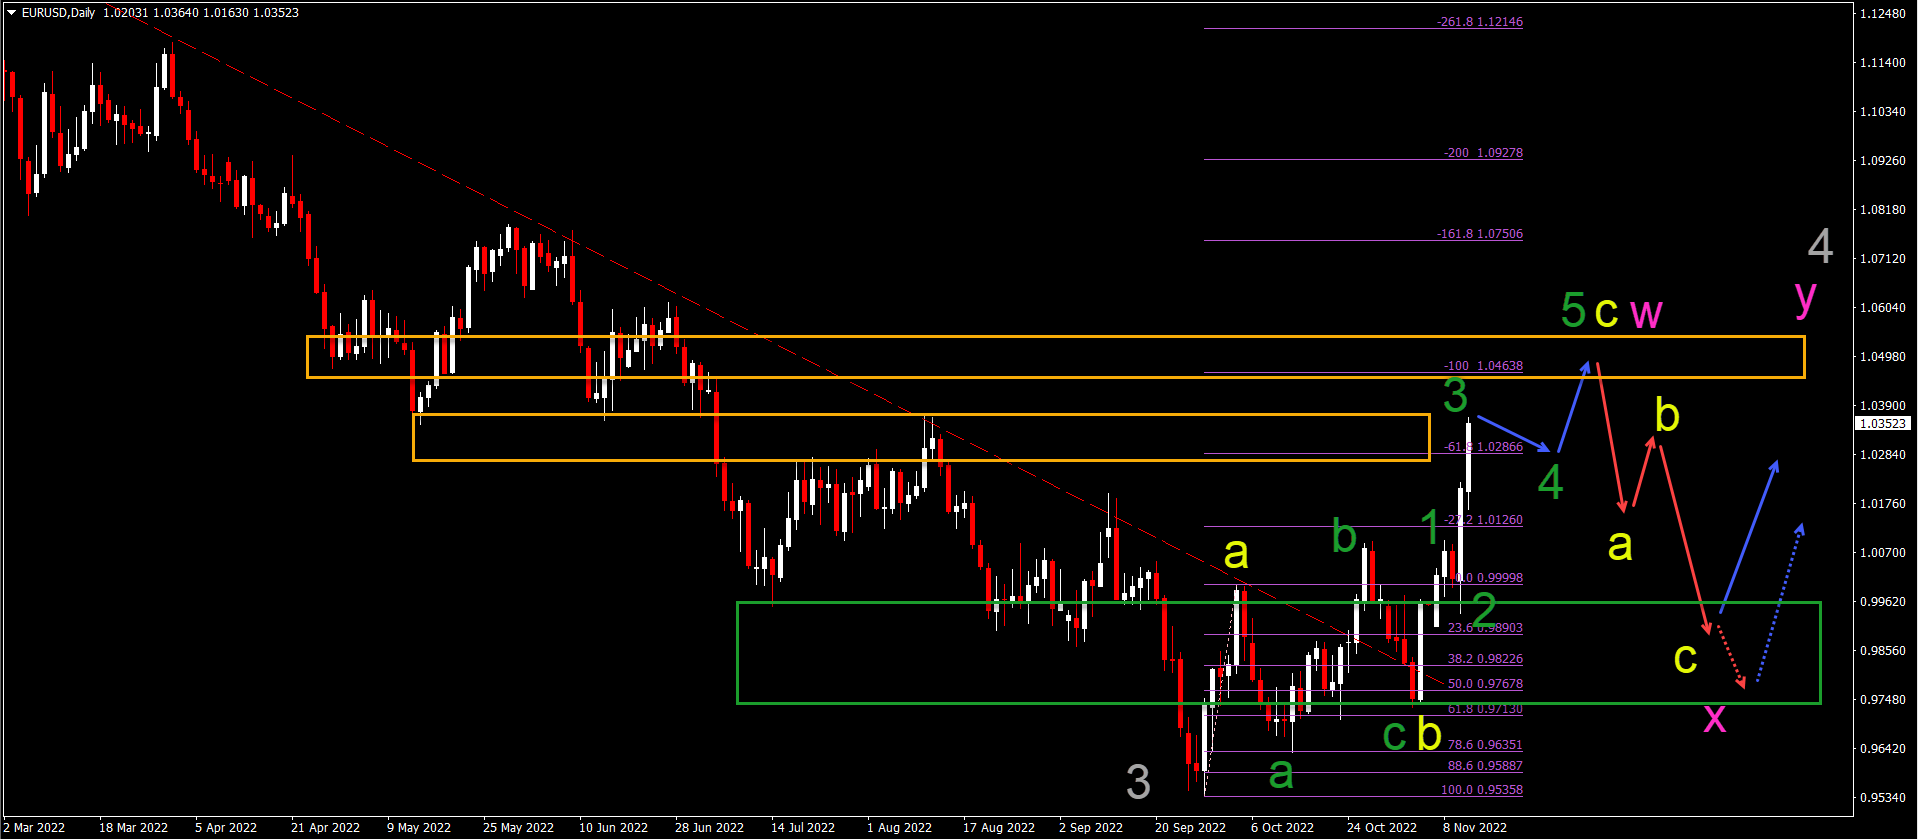
The EURUSD made a very strong bullish swing last week. Price made a bullish bounce at 0.9950 and rallied 400 pips to reach 1.0350:
-
The EURUSD rally started after price action completed a bearish ABC (yellow) pattern in wave B (green).
-
The EURUSD tested and bounced at the 61.8% Fibonacci retracement support level.
-
A larger ABC (yellow) zigzag seems to be unfolding within a complex WXY (pink) correction of wave 4 (gray).
-
Within the wave C (yellow), price action is moving in a 5 wave pattern (green).
-
We expect wave 3 (green) to finish soon, which is then followed by wave 4 (green) and wave 5 (green).
-
The main target is the -100% Fibonacci level near 1.0450 and 1.05.
-
A bearish ABC (red arrow) should emerge at this target zone.
Bitcoin bearish drop bounces at $15k
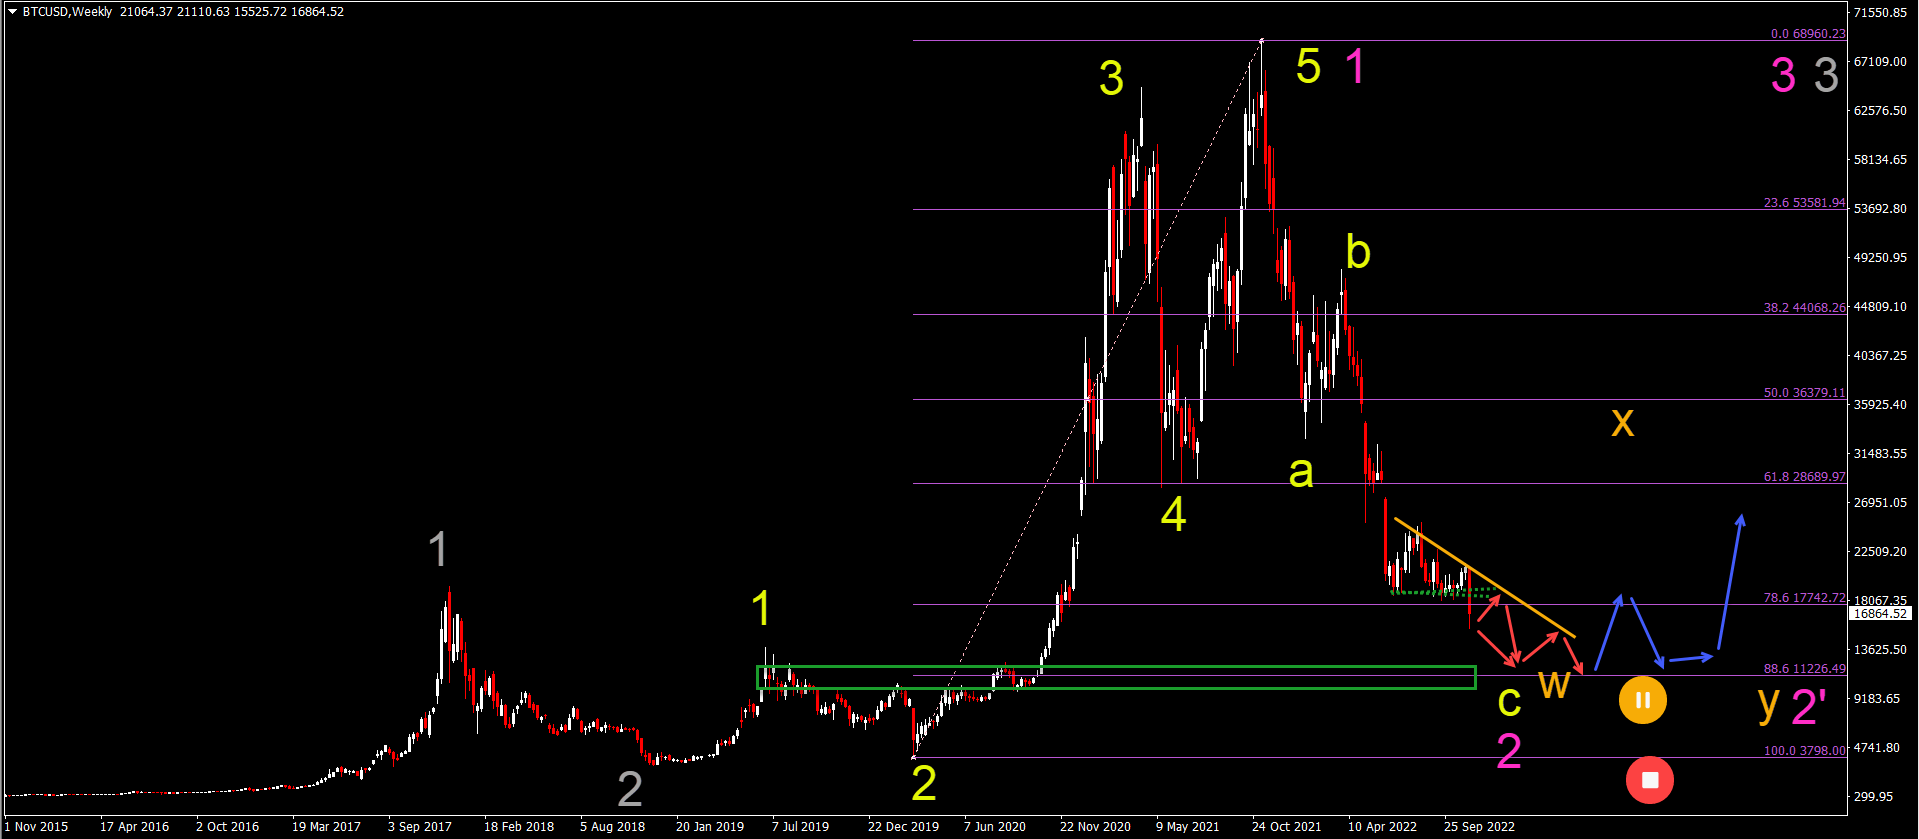
Bitcoin (BTCUSD) broke below the support trend lines (dotted green) after moving sideways at the 78.6% Fibonacci support level for a couple of months:
-
The BTCUSD bearish breakout below the 78.6% Fibonacci level confirms a continuation of the bearish wave C (yellow).
-
The target of the bearish wave C (yellow) is now at the 88.6% Fibonacci level at $11.2k. Other rounds levels like $15k and $12.5k will also act as support.
-
Price action already made a bounce at the $15k level but a further decline is possible after the bullish correction is completed.
-
A falling wedge pattern (red arrows) could develop as price action inches closer to the $11k mark.
-
Price action could complete a wave C (yellow) of wave 2 (pink) or a wave C of wave W (orange) of a larger wave 2’ (pink).
-
A bullish bounce (blue arrows) could emerge at the 88.6% Fibonacci level.
Gold bull flag patterns hint at more upside
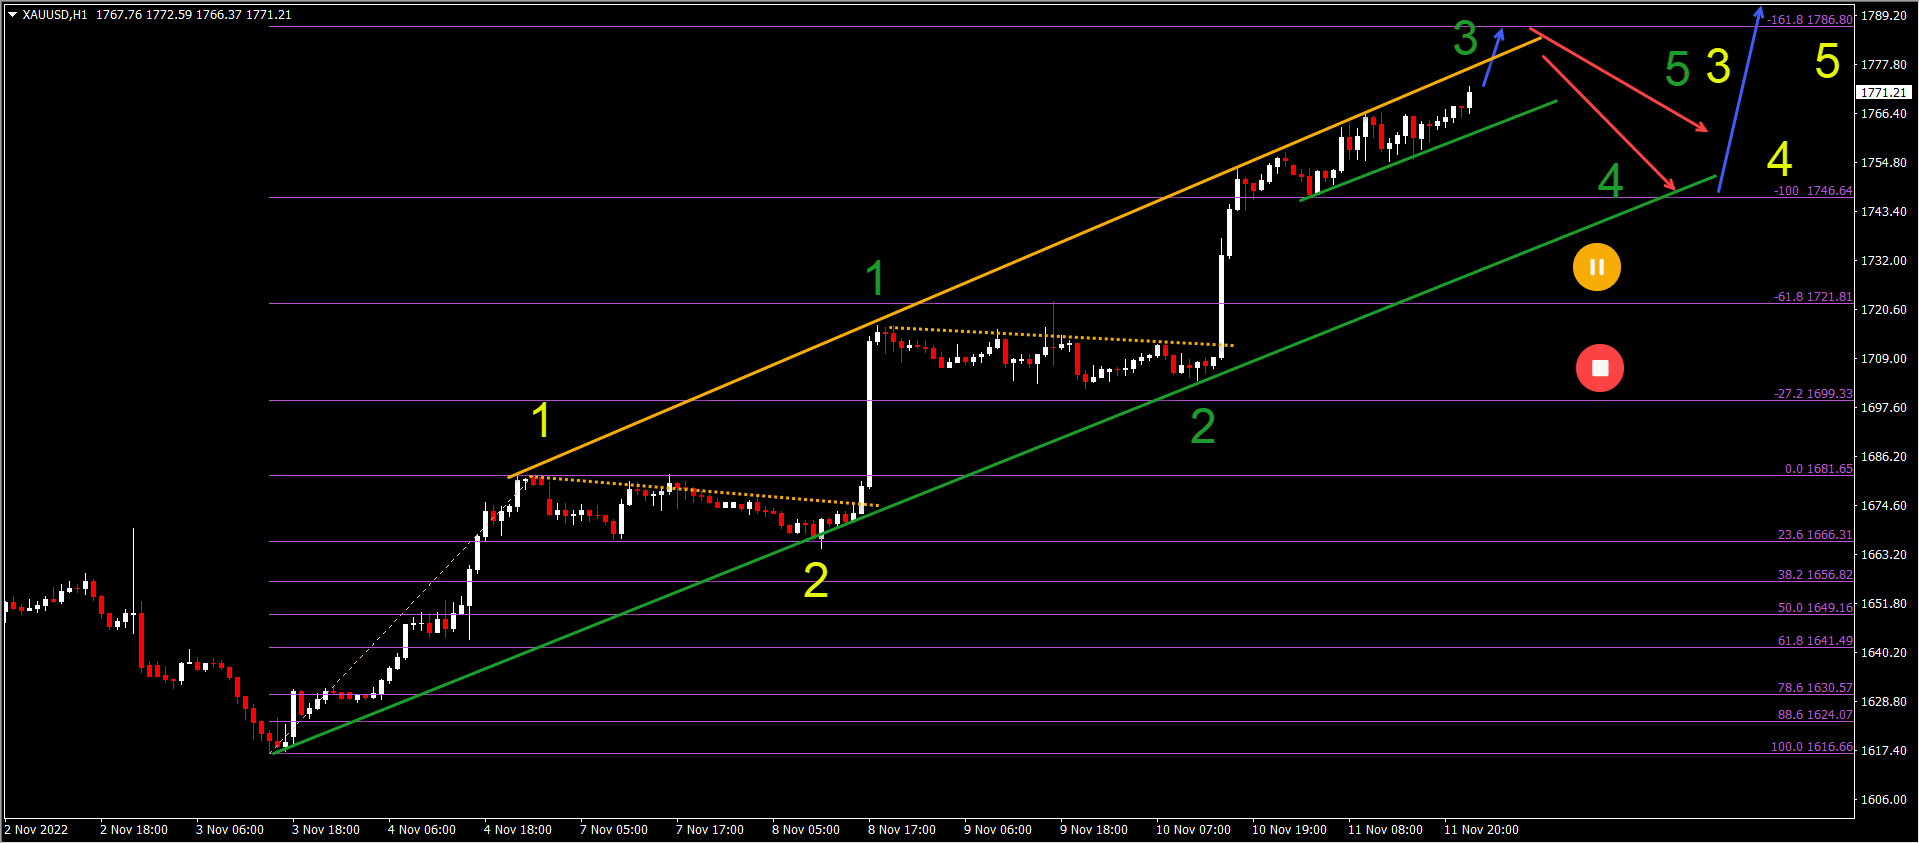
Gold (XAUUSD) is moving up higher within a bullish trend channel after creating a double bottom chart pattern on the 4 hour and daily charts:
-
The Gold chart made several bullish breakouts above the resistance trend line (dotted orange).
-
Gold seems to be developing an impulsive price swing with a 5 wave pattern (green) in wave 3 (yellow).
-
Price action is expected to continue higher (blue arrow) towards the -161.8% Fibonacci target.
-
Once the wave 3 (green) is completed, a bearish retracement (red arrows) is expected within wave 4 (green).
-
The wave 4 (green) remains valid as long as price action remains in the bullish channel.
-
A bullish bounce should take place within wave 5 (green) of wave 5 (yellow).
The analysis has been done with the indicators and template from the SWAT method simple wave analysis and trading. For more daily technical and wave analysis and updates, sign-up to our newsletter
Author

Chris Svorcik
Elite CurrenSea
Experience Chris Svorcik has co-founded Elite CurrenSea in 2014 together with Nenad Kerkez, aka Tarantula FX. Chris is a technical analyst, wave analyst, trader, writer, educator, webinar speaker, and seminar speaker of the financial markets.


