Weekly waves: EUR/USD, GBP/USD and Gas
-
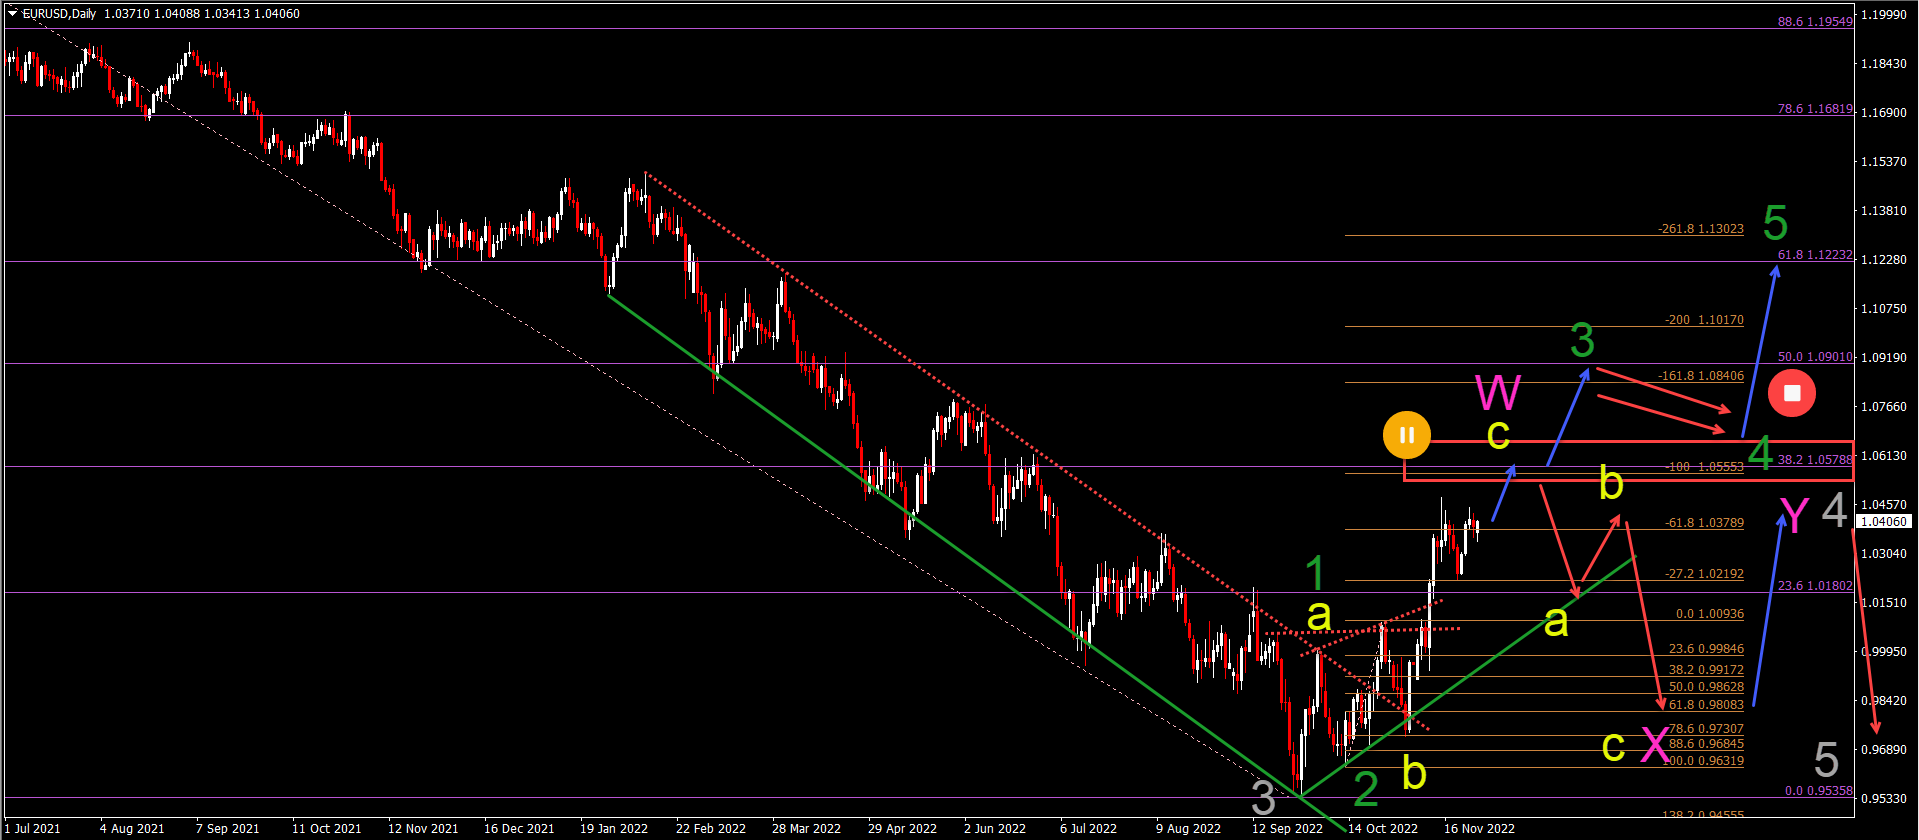
The EUR/USD is approaching a key resistance zone at the 38.2%-50% Fibonacci levels (red box) at the 1.05-1.0575 zone.
-
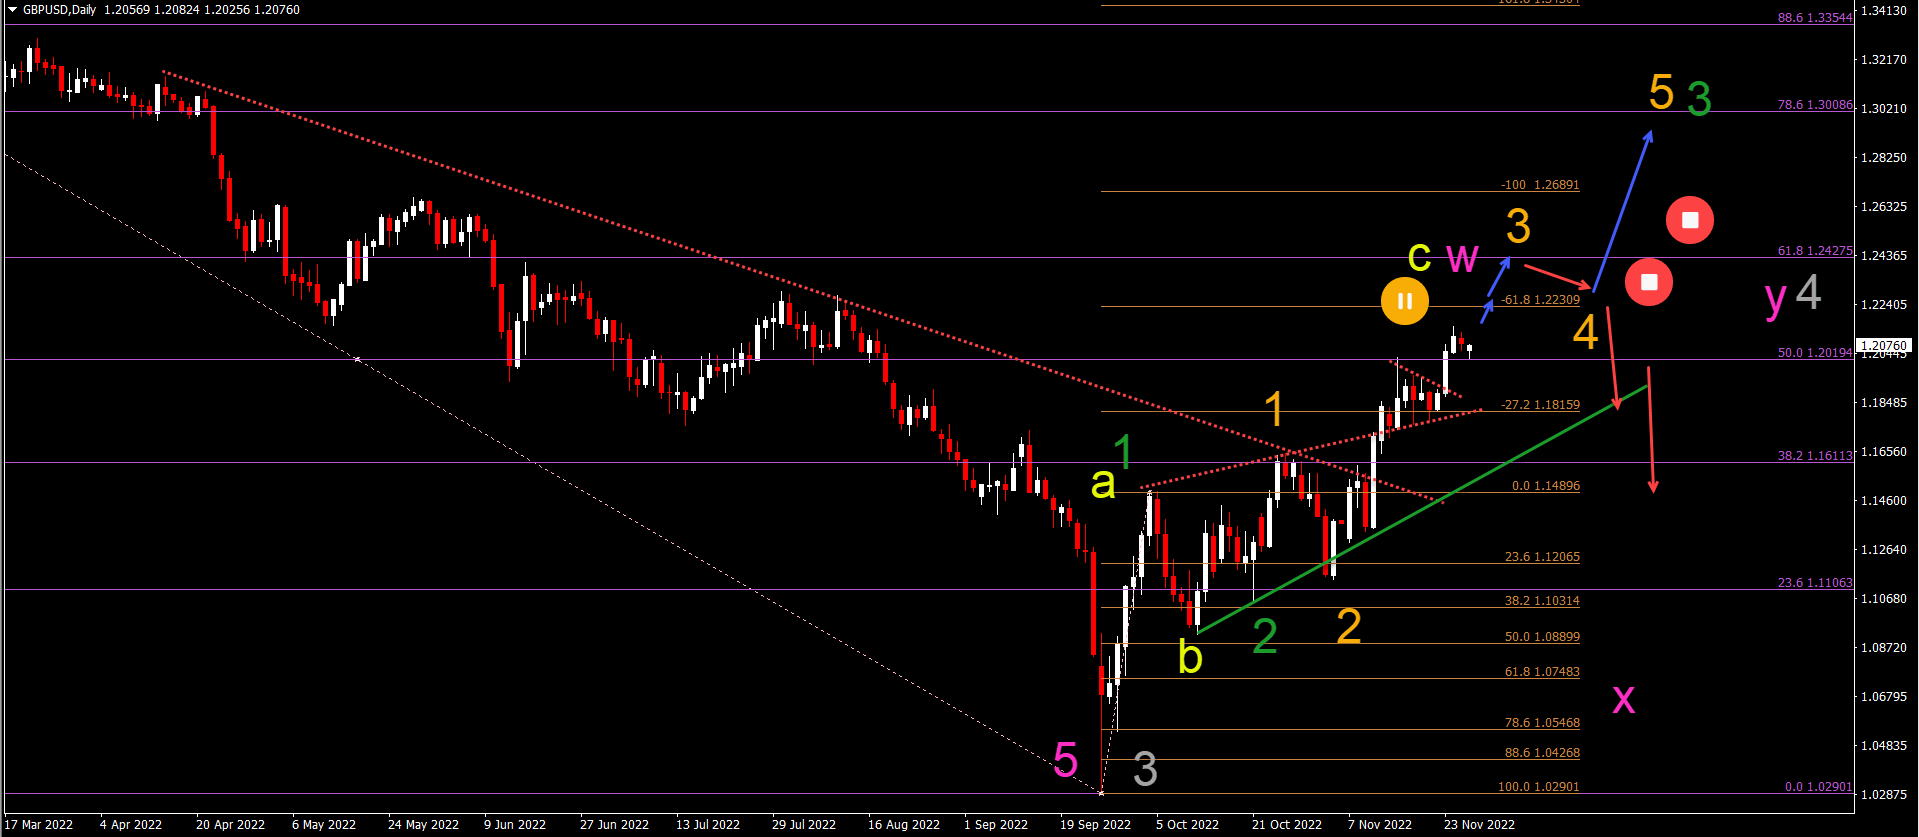
The GBP/USD is breaking above the 50% Fibonacci resistance level, which is undermining the long-term bearish wave analysis.
-
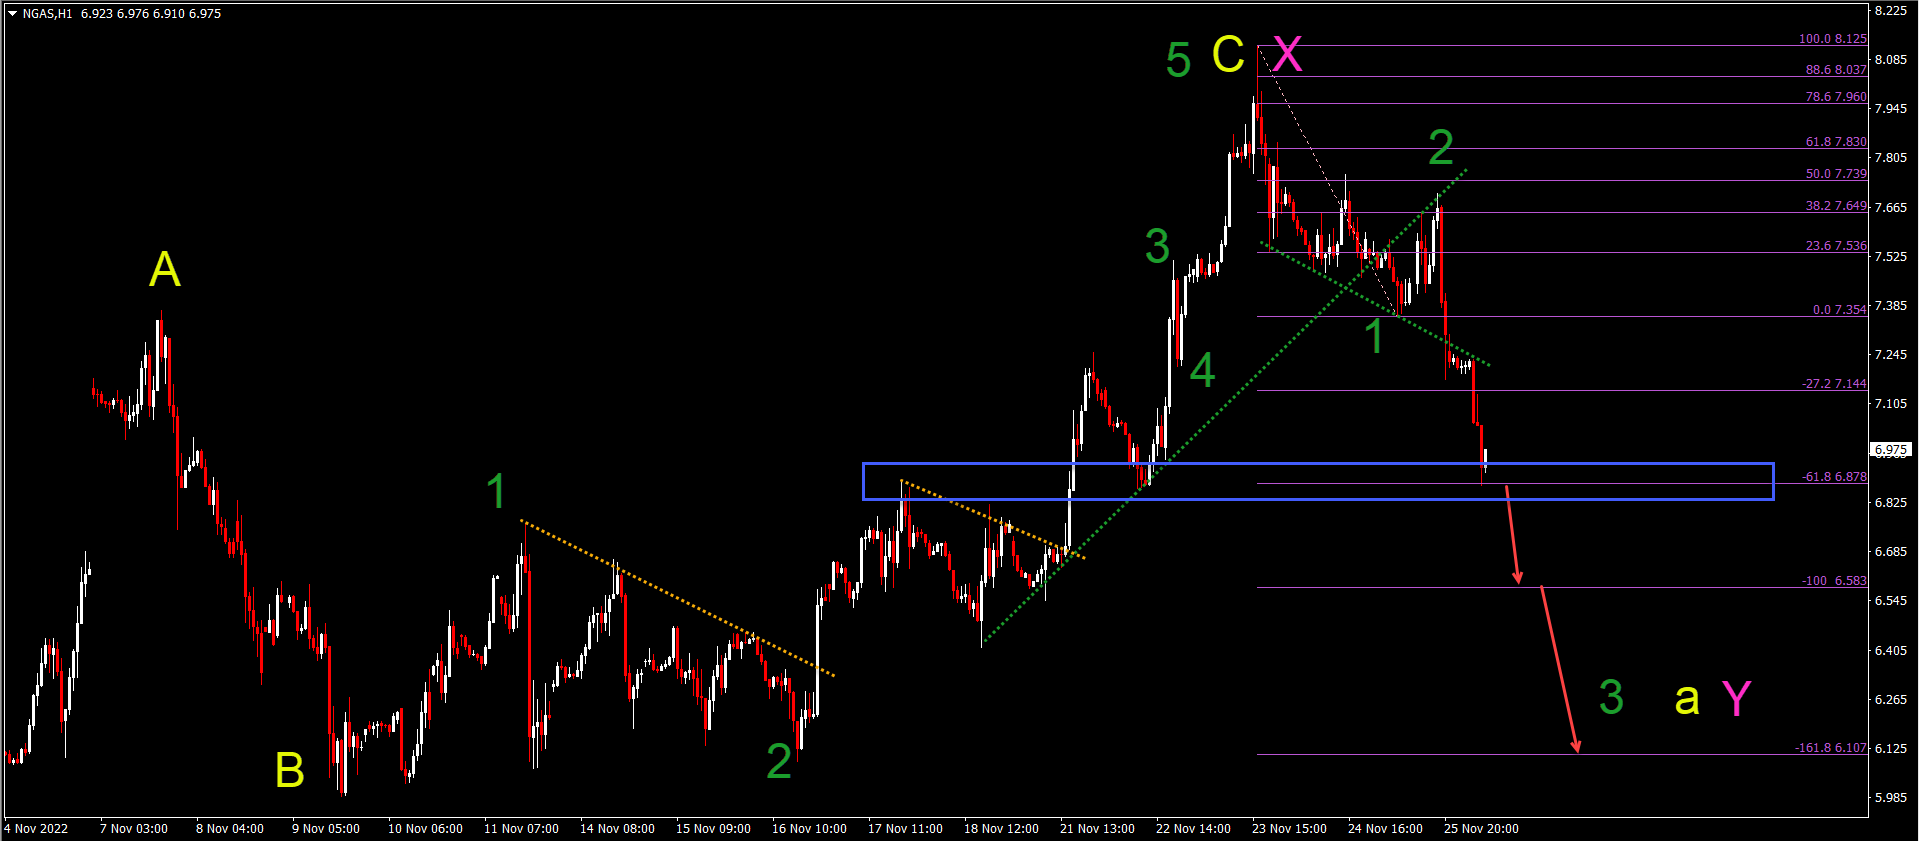
The NGAS has completed a 5 wave pattern (green) in wave C (yellow) of a larger wave X (pink). Price action has reached the -61.8% Fibonacci target which is a key level.

EUR/USD reaches key 38.2-50% Fibonacci resistance zone
The EUR/USD is showing a short-term uptrend with higher highs and higher lows but what is the long-term picture? Let’s review:
-
The EUR/USD made a bullish breakout above the resistance trend lines (dotted red).
-
The EUR/USD is approaching a key resistance zone at the 38.2%-50% Fibonacci levels (red box) at the 1.05-1.0575 zone.
-
A bullish breakout would indicate a larger bullish retracement such as a 12345 (green) pattern.
-
A bearish bounce makes a different ABC (yellow) pattern possible within a complex WXY (pink) pattern of wave 4 (gray).
-
The key pattern is the bull flag pattern after the bullish breakout, which makes a wave 4 (green) pattern likely.
GBP/USD breaks above key 50% Fibonacci level
The GBP/USD is breaking above the 50% Fibonacci resistance level, which is undermining the long-term bearish wave analysis:
-
The GBP/USD bullish breakouts above the resistance trend lines (dotted red) indicate a large bullish retracement.
-
A bullish continuation followed by a bull flag pattern indicates a wave 345 (orange) pattern.
-
A strong bearish bounce, however, could still indicate an ABC (yellow) within a complex WXY (pink) of a larger wave 4 (gray).
-
The GBP/USD is at a key critical zone where price action is testing a bull-bear line. A break or bounce is critical for the next price swing.
Natural Gas reaches key -61.8% Fibonacci target
NGAS is back into a bearish mode after making a strong move up:
-
The NGAS has completed a 5 wave pattern (green) in wave C (yellow) of a larger wave X (pink).
-
Price action has reached the -61.8% Fibonacci target which is a key level.
-
A bearish breakout below the support zone (blue box) could indicate a decline towards the Fibonacci targets.
-
The bearish breakout could confirm a new bearish 5 wave pattern (green).
The analysis has been done with the indicators and template from the SWAT method simple wave analysis and trading. For more daily technical and wave analysis and updates, sign-up to our newsletter
Author

Chris Svorcik
Elite CurrenSea
Experience Chris Svorcik has co-founded Elite CurrenSea in 2014 together with Nenad Kerkez, aka Tarantula FX. Chris is a technical analyst, wave analyst, trader, writer, educator, webinar speaker, and seminar speaker of the financial markets.


