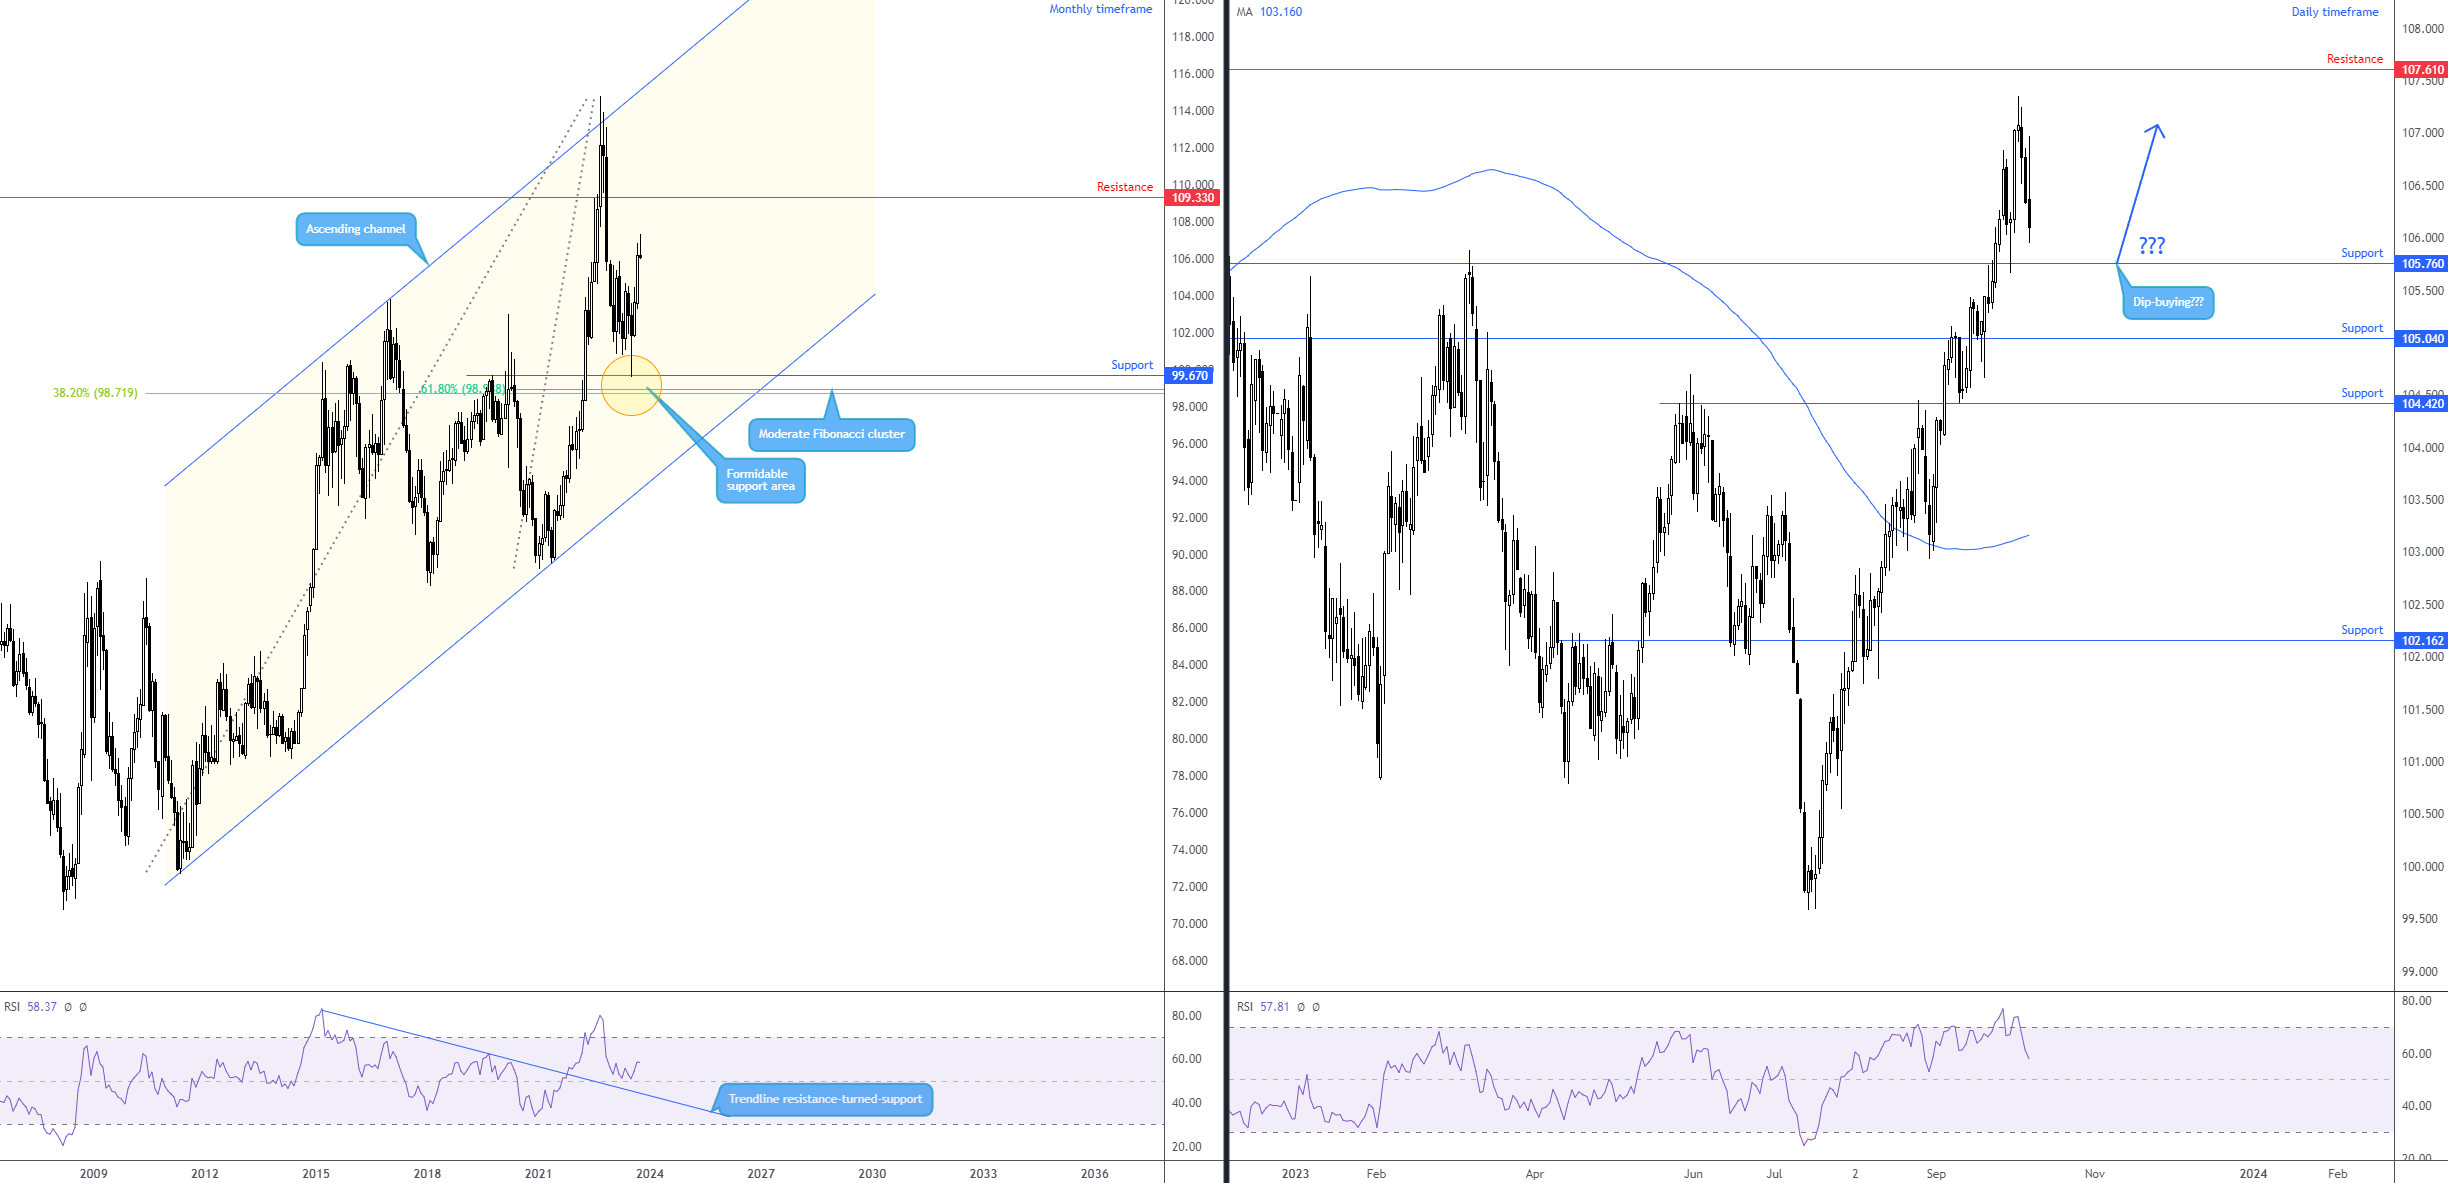
Weekly outlook and review: Dollar Index snaps 11-week winning streak – Dip buying?

The Dollar Index finished the first full week of October eking out marginal losses, falling -0.1% and snapping an 11-week winning streak.
Technically speaking, though, the trend on both the monthly and daily timeframes continues to favour buying despite the decline seen in the second half of last week. Momentum also still leans in favour of buyers. The Relative Strength Index (RSI) shows the index is demonstrating signs of bottoming ahead of the 50.00 centreline on the monthly chart, while the RSI on the daily chart has forged negative divergence out of overbought space. Despite a mixed vibe here, considering the uptrend and the monthly RSI generally taking precedence over lower timeframes, the pendulum is swinging in favour of USD bulls.
The monthly chart demonstrates scope to push as far north as resistance from 109.33, following July’s rebound from support at 99.67. The daily chart, on the other hand, shines the technical spotlight towards resistance at 107.61, with neighbouring support at 105.76 to perhaps demand attention this week.
What does this mean for the buck going forward?
Daily support at 105.76 is worthy of this week’s watchlist, a base that could attract dip-buying in light of the technical factors aired above.
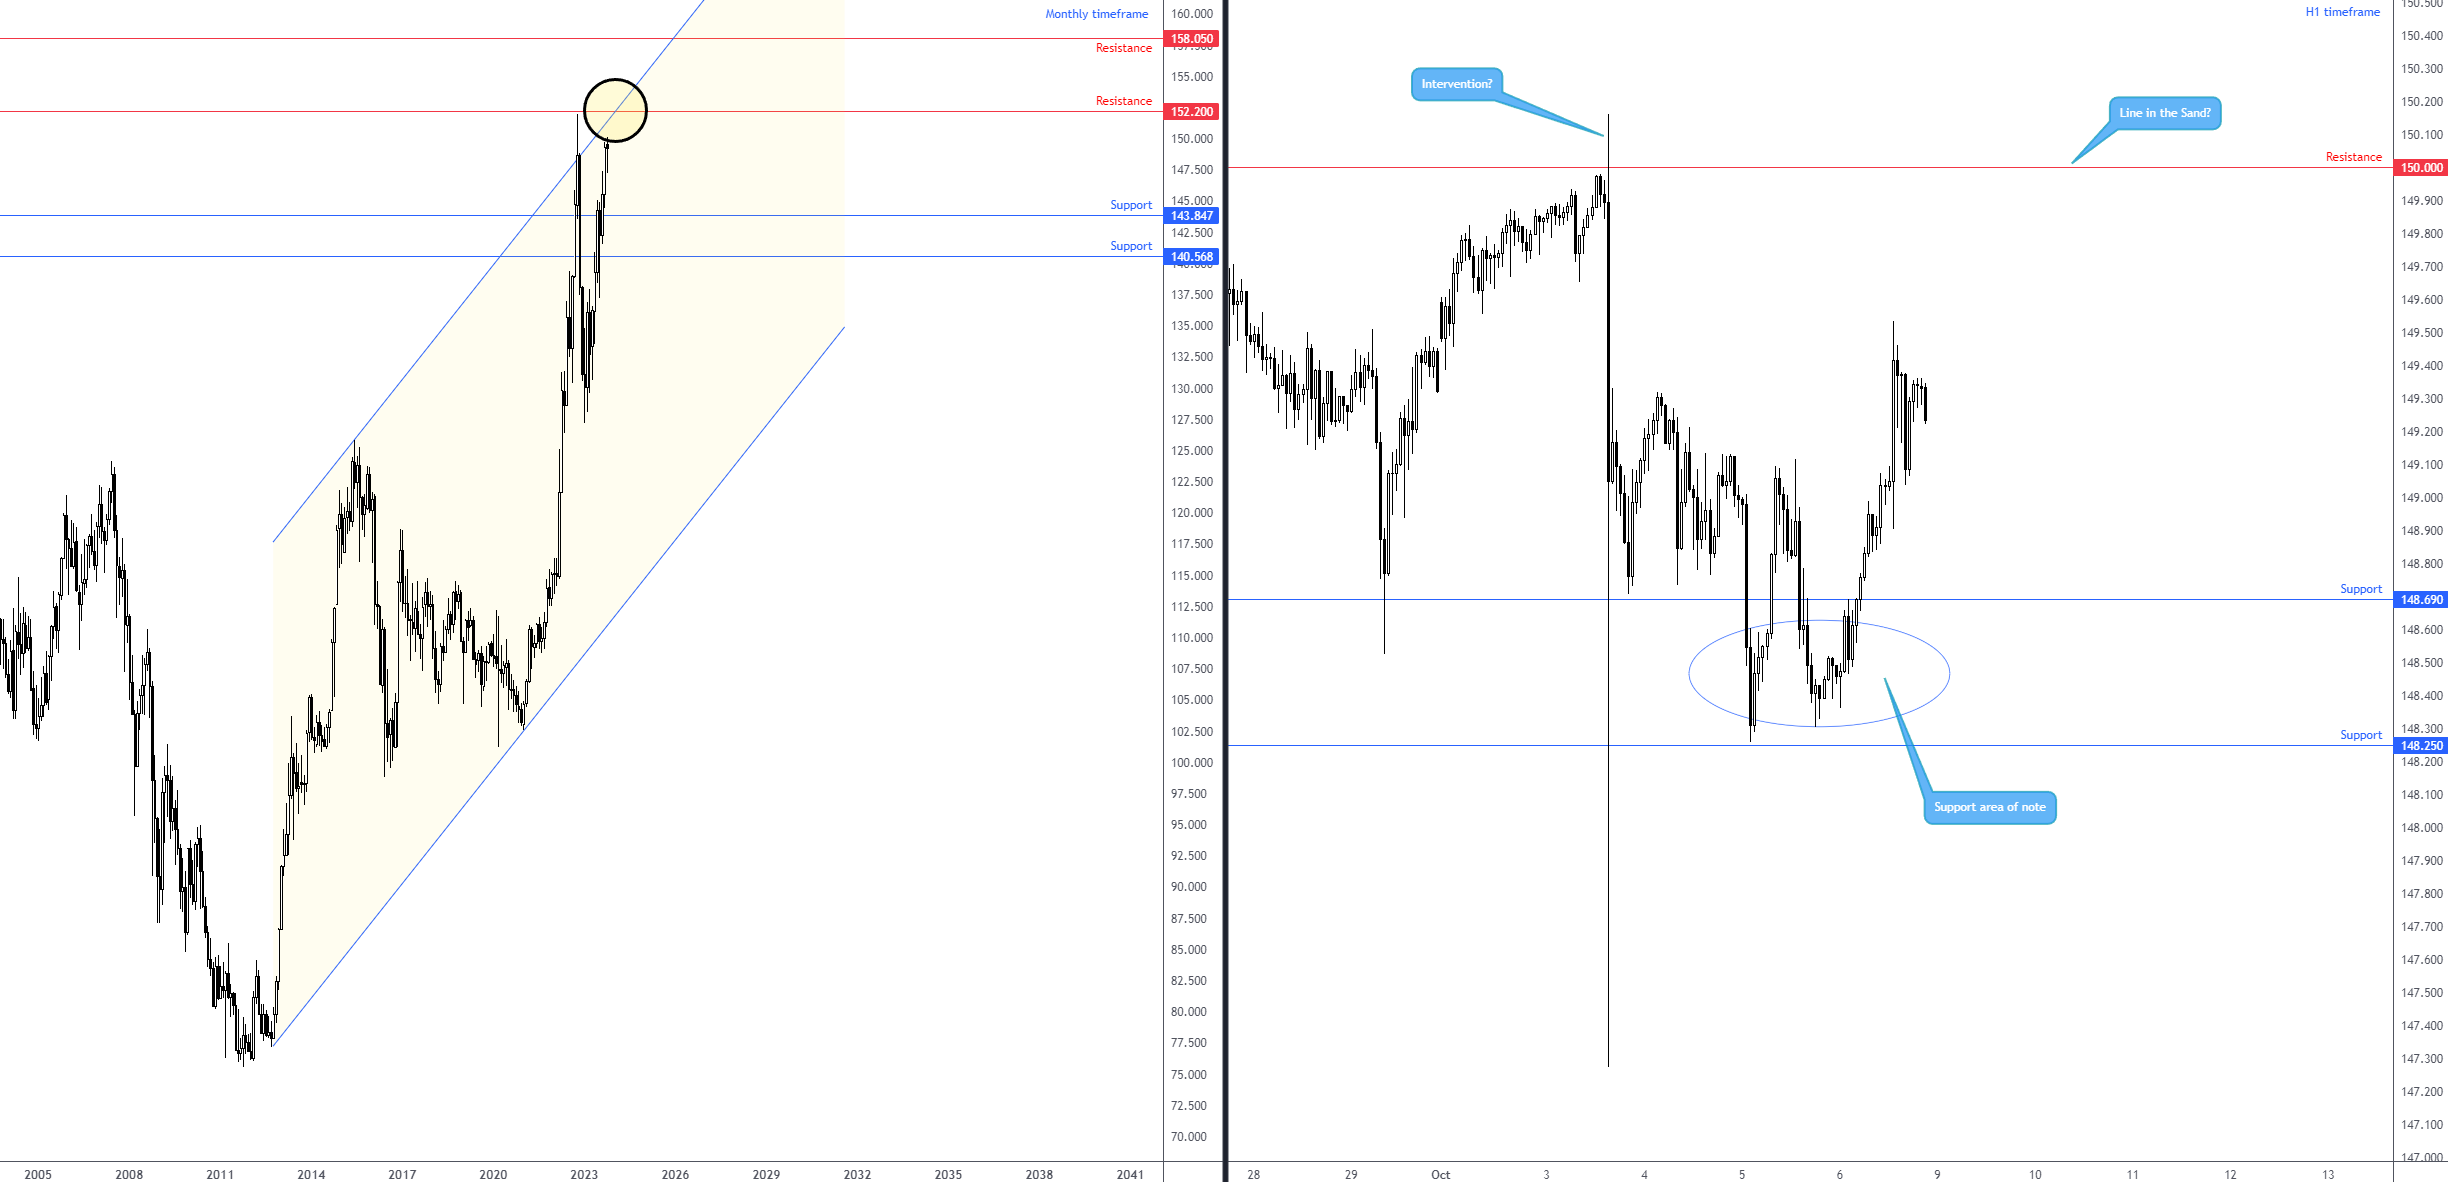
USD/JPY: Interesting market last week
A move from ¥150.00 to around ¥147.00 was seen in the space of two minutes last week. As of writing, Japanese officials did not confirm whether an intervention was the cause. Regardless, the sell-off from the ¥150.00 handle was drastic and likely caught many traders and investors off guard.
From the monthly timeframe, the technical picture points to further upside for the currency pair over the coming weeks/months until shaking hands with ¥152.20 resistance. This resistance also shares chart space with channel resistance, extended from the high of ¥125.86.
You may recall that the Research Team released a piece on the USD/JPY’s short-term technical picture last week, which can be found here.
Following yesterday’s spike lower, subsequent price action has seen buyers and sellers squaring off around H1 support at ¥148.69, with a break of here opening the door for another layer of H1 support coming in at ¥148.25.
Technically, given the strength of the buck of late—higher for eleven consecutive weeks—the support area between ¥148.25 and ¥148.69 on the USD/JPY could hold steady and eventually welcome additional bids into the market to challenge the mettle of the ¥150.00 level once again. Any defined breakout north of the aforementioned base could attract breakout buying.
As you can see from the H1 chart, buyers did indeed make their way into the fray from the ¥148.25-¥148.69 support zone, with little resistance stopping price from retesting ¥150.00 again. Therefore, knowing the monthly timeframe exhibits scope to move beyond ¥150.00 to at least ¥152.00, this may see short-term traders bid this market higher this week.
Charts: TradingView
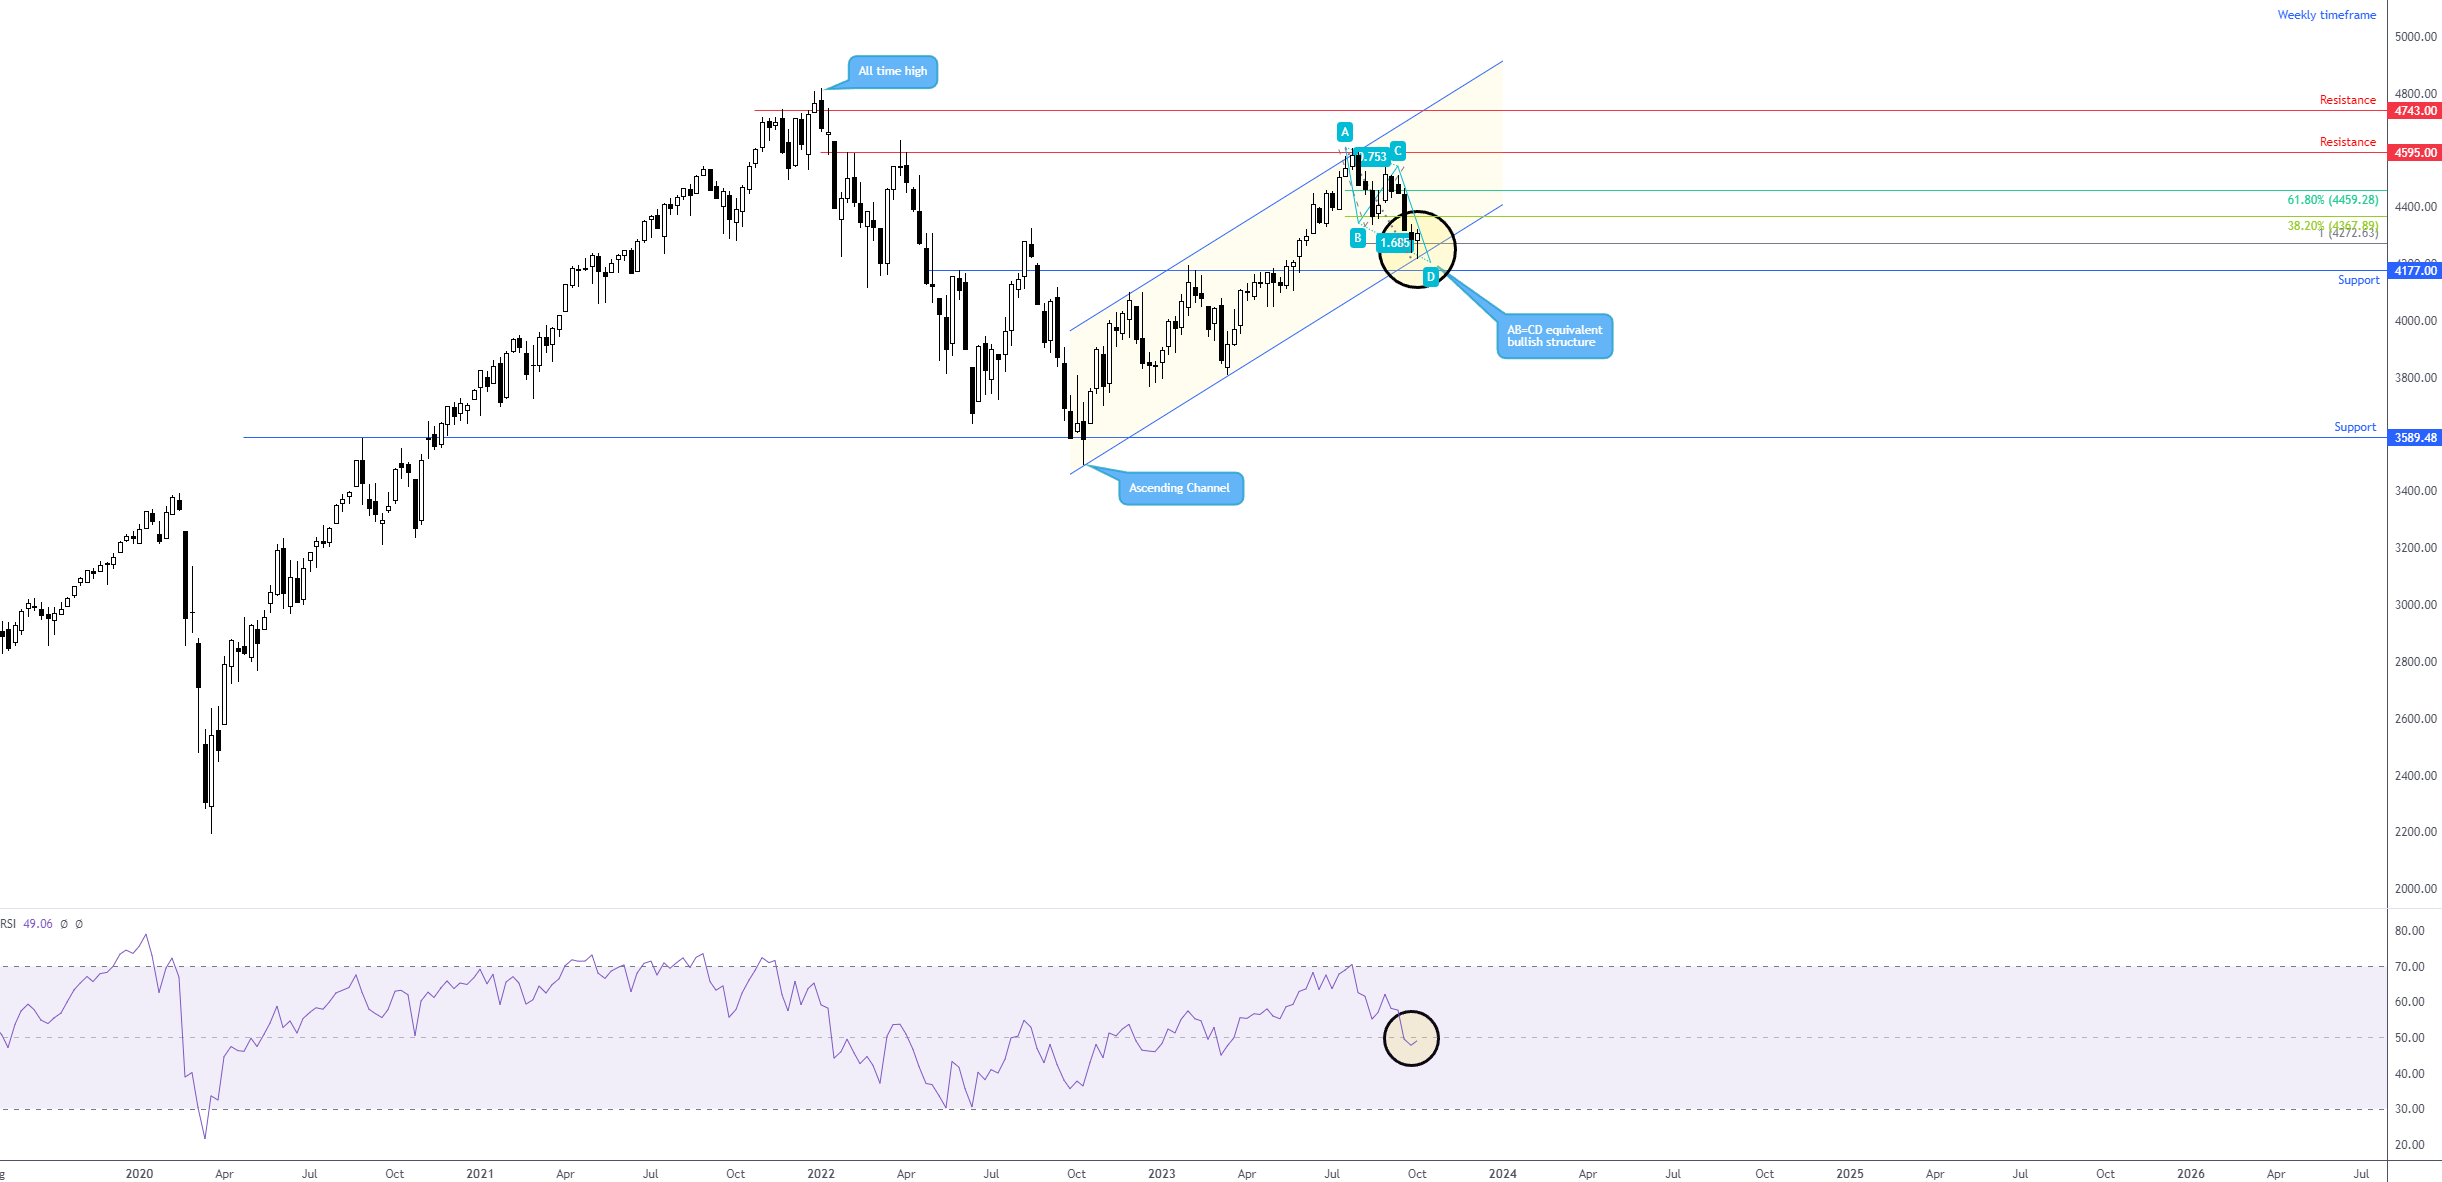
AB=CD structure visible on the S&P 500 and Dow
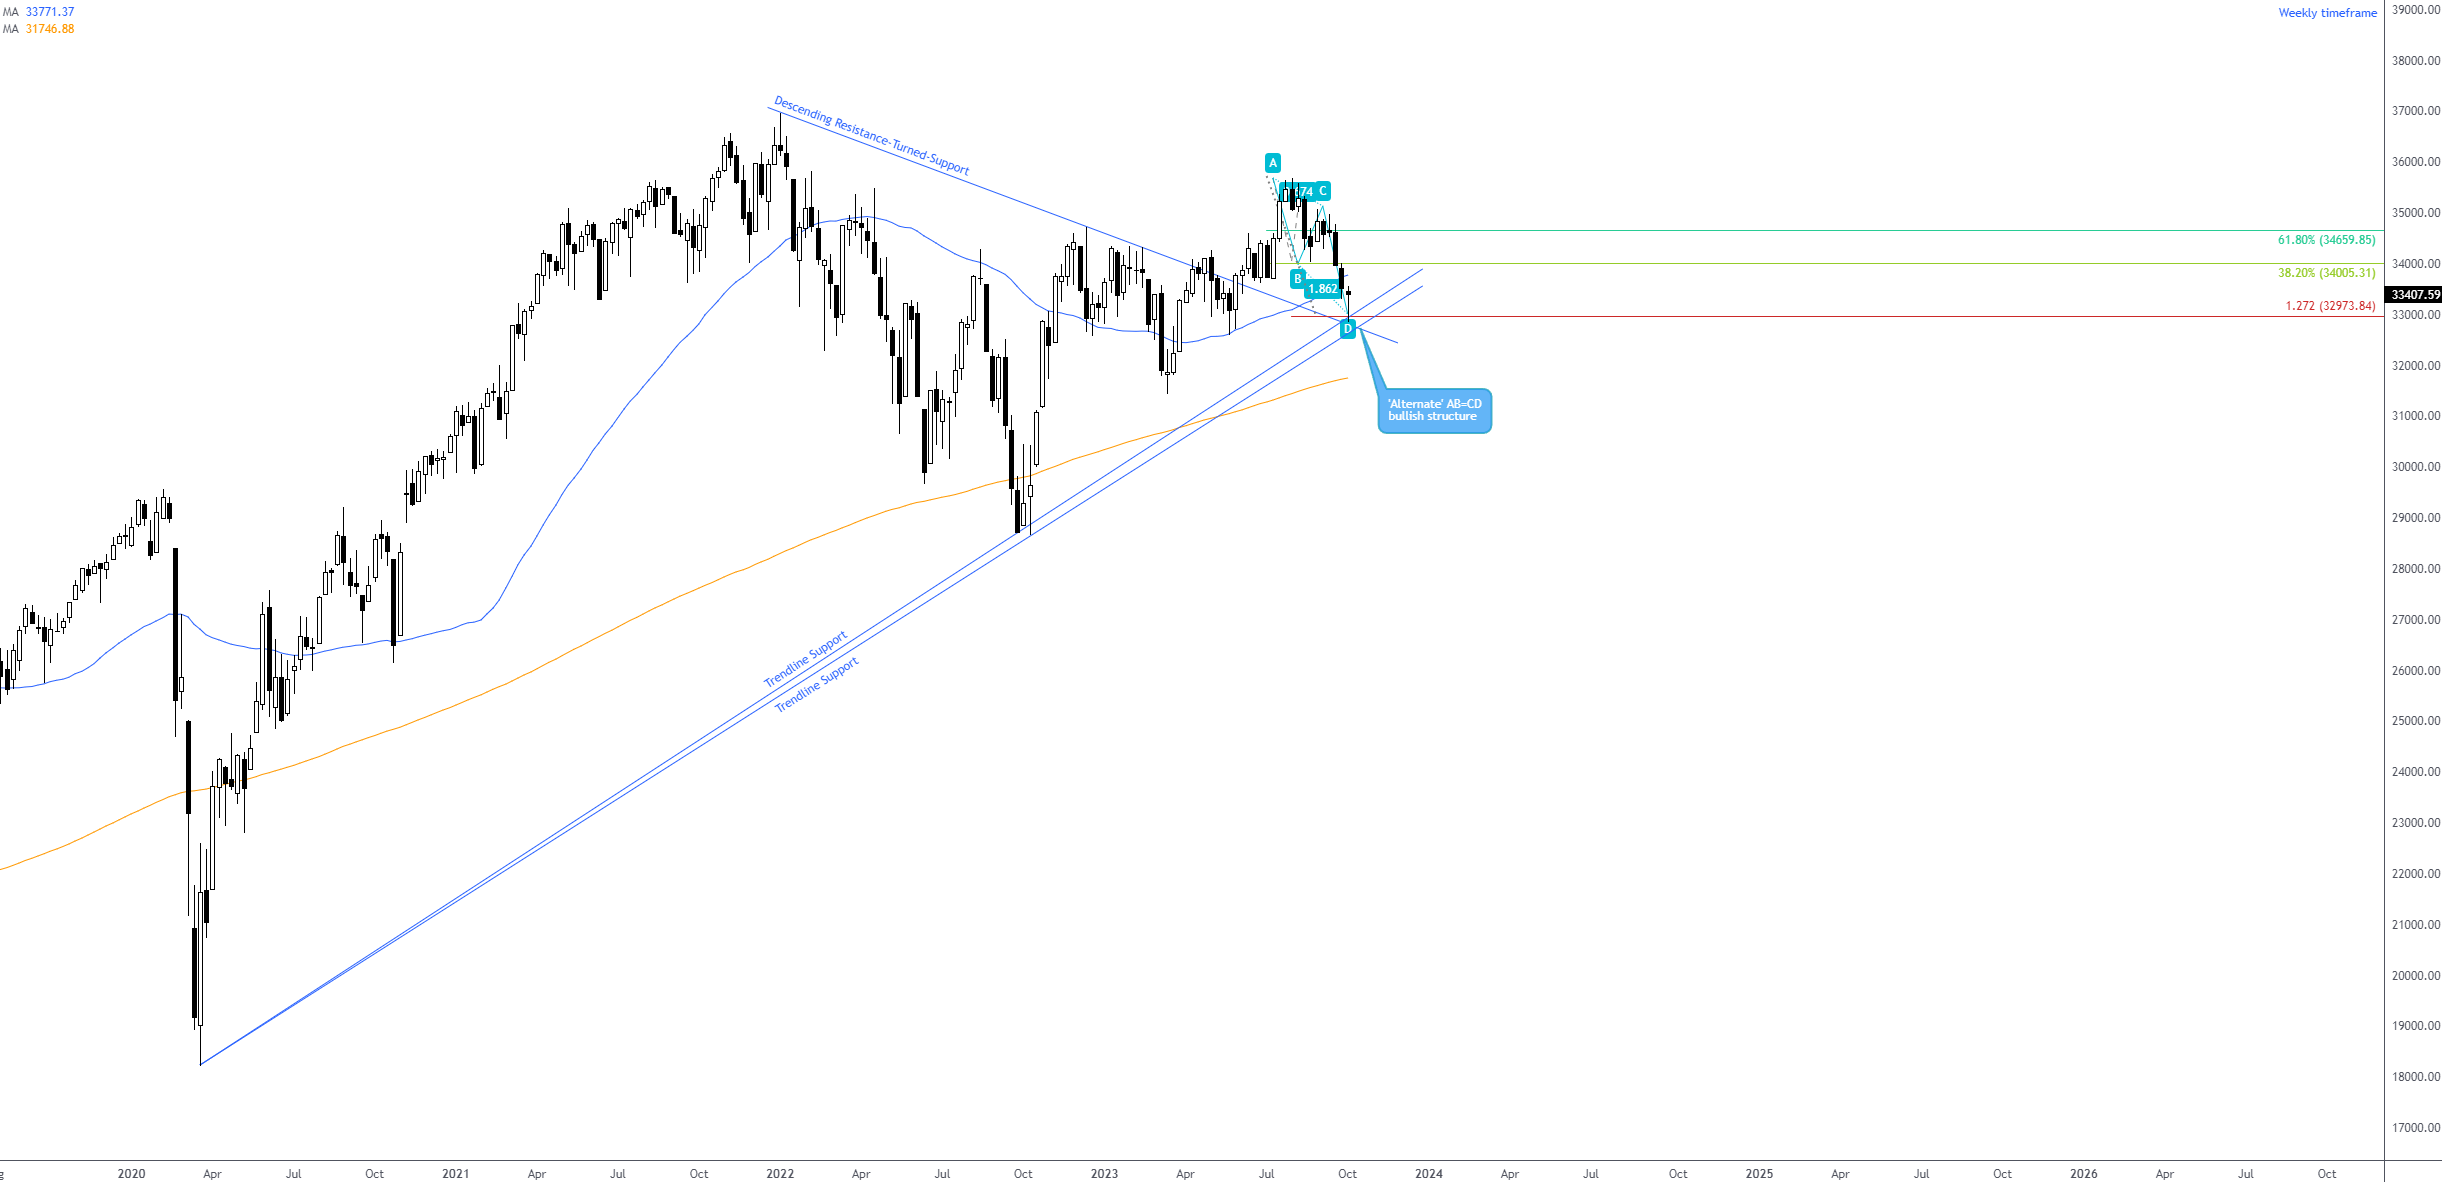
Aside from the Dow Jones Industrial Average (Dow), which ended -0.3% lower, last week witnessed gains across major US equity indices.
The S&P 500 snapped a 4-week losing streak and rebounded from channel support on the weekly timeframe, taken from the low of 3,491. Additional technical confluence underpinning price can be seen in the form of an equivalent AB=CD support structure at 4,272 (100% projection ratio) and the Relative Strength Index (RSI) showing signs of rebounding from the 50.00 centreline, as well as the overall trend facing higher.
Together, this may mean that further upside could be on the table for the S&P 500 over the next few weeks, targeting the 38.2% and 61.8% Fibonacci retracement ratios at 4,367 and 4,459, respectively (common upside targets derived from legs A-D).
Charts: TradingView
A similar vibe is seen on the Dow from the weekly timeframe. As evident from the chart below, the week concluded by testing an ‘alternate’ AB=CD bullish formation at 32,973 (depicted by a 1.272% Fibonacci projection ratio). You will note that the AB=CD pattern is joined closely by a descending resistance-turned-support taken from the high of 36,952 and trendline support extended from the low of 18,213.
Like the S&P 500 this week (and potentially subsequent weeks), buyers from the current structure may aim for the 38.2% and 61.8% Fibonacci retracement ratios at 34,005 and 34,659, respectively (common upside targets derived from legs A-D).
Charts: TradingView
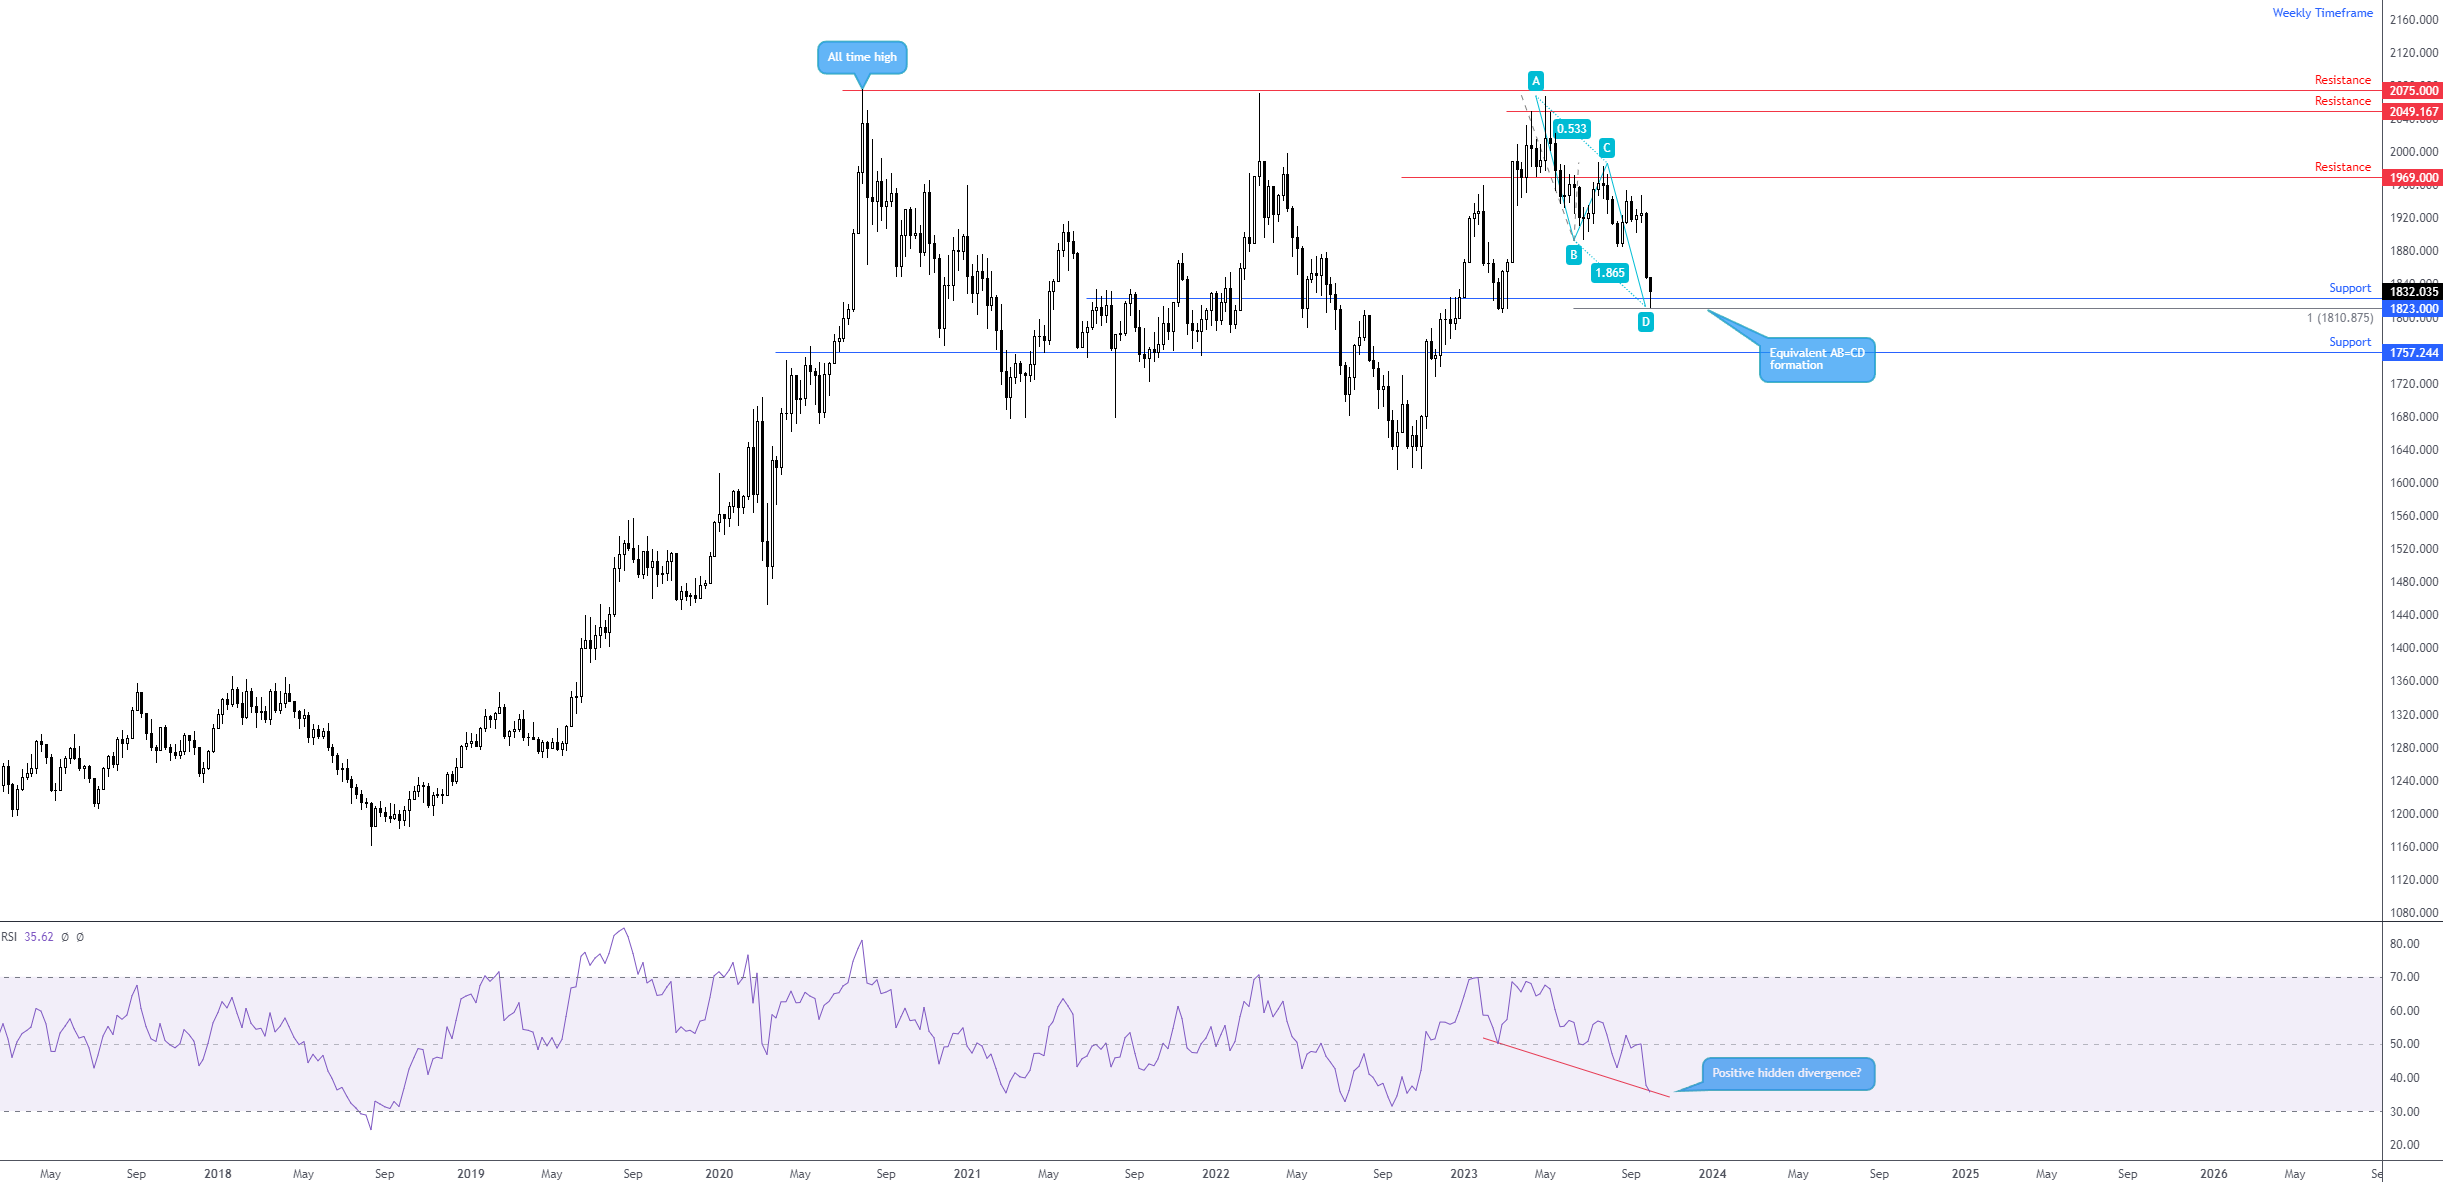
Spot Gold (XAU/USD): Bullish offensive this week?
The price of spot gold in dollar terms settled lower for a second straight session last week, erasing -0.9% and absorbing bids at weekly support from $1,823. Complementing the aforesaid support is a nearby weekly equivalent AB=CD bullish structure at $1,810 (shown through the 100% projection ratio), joined by what appears to be hidden positive divergence from the Relative Strength Index (RSI). Although not shown, the monthly timeframe’s RSI is also seen testing the upper side of its 50.00 centreline: positive momentum. From a trend perspective on the weekly scale, however, the precious metal has been largely rangebound since pencilling in its all-time high of $2,075 in 2020.
Charts: TradingView
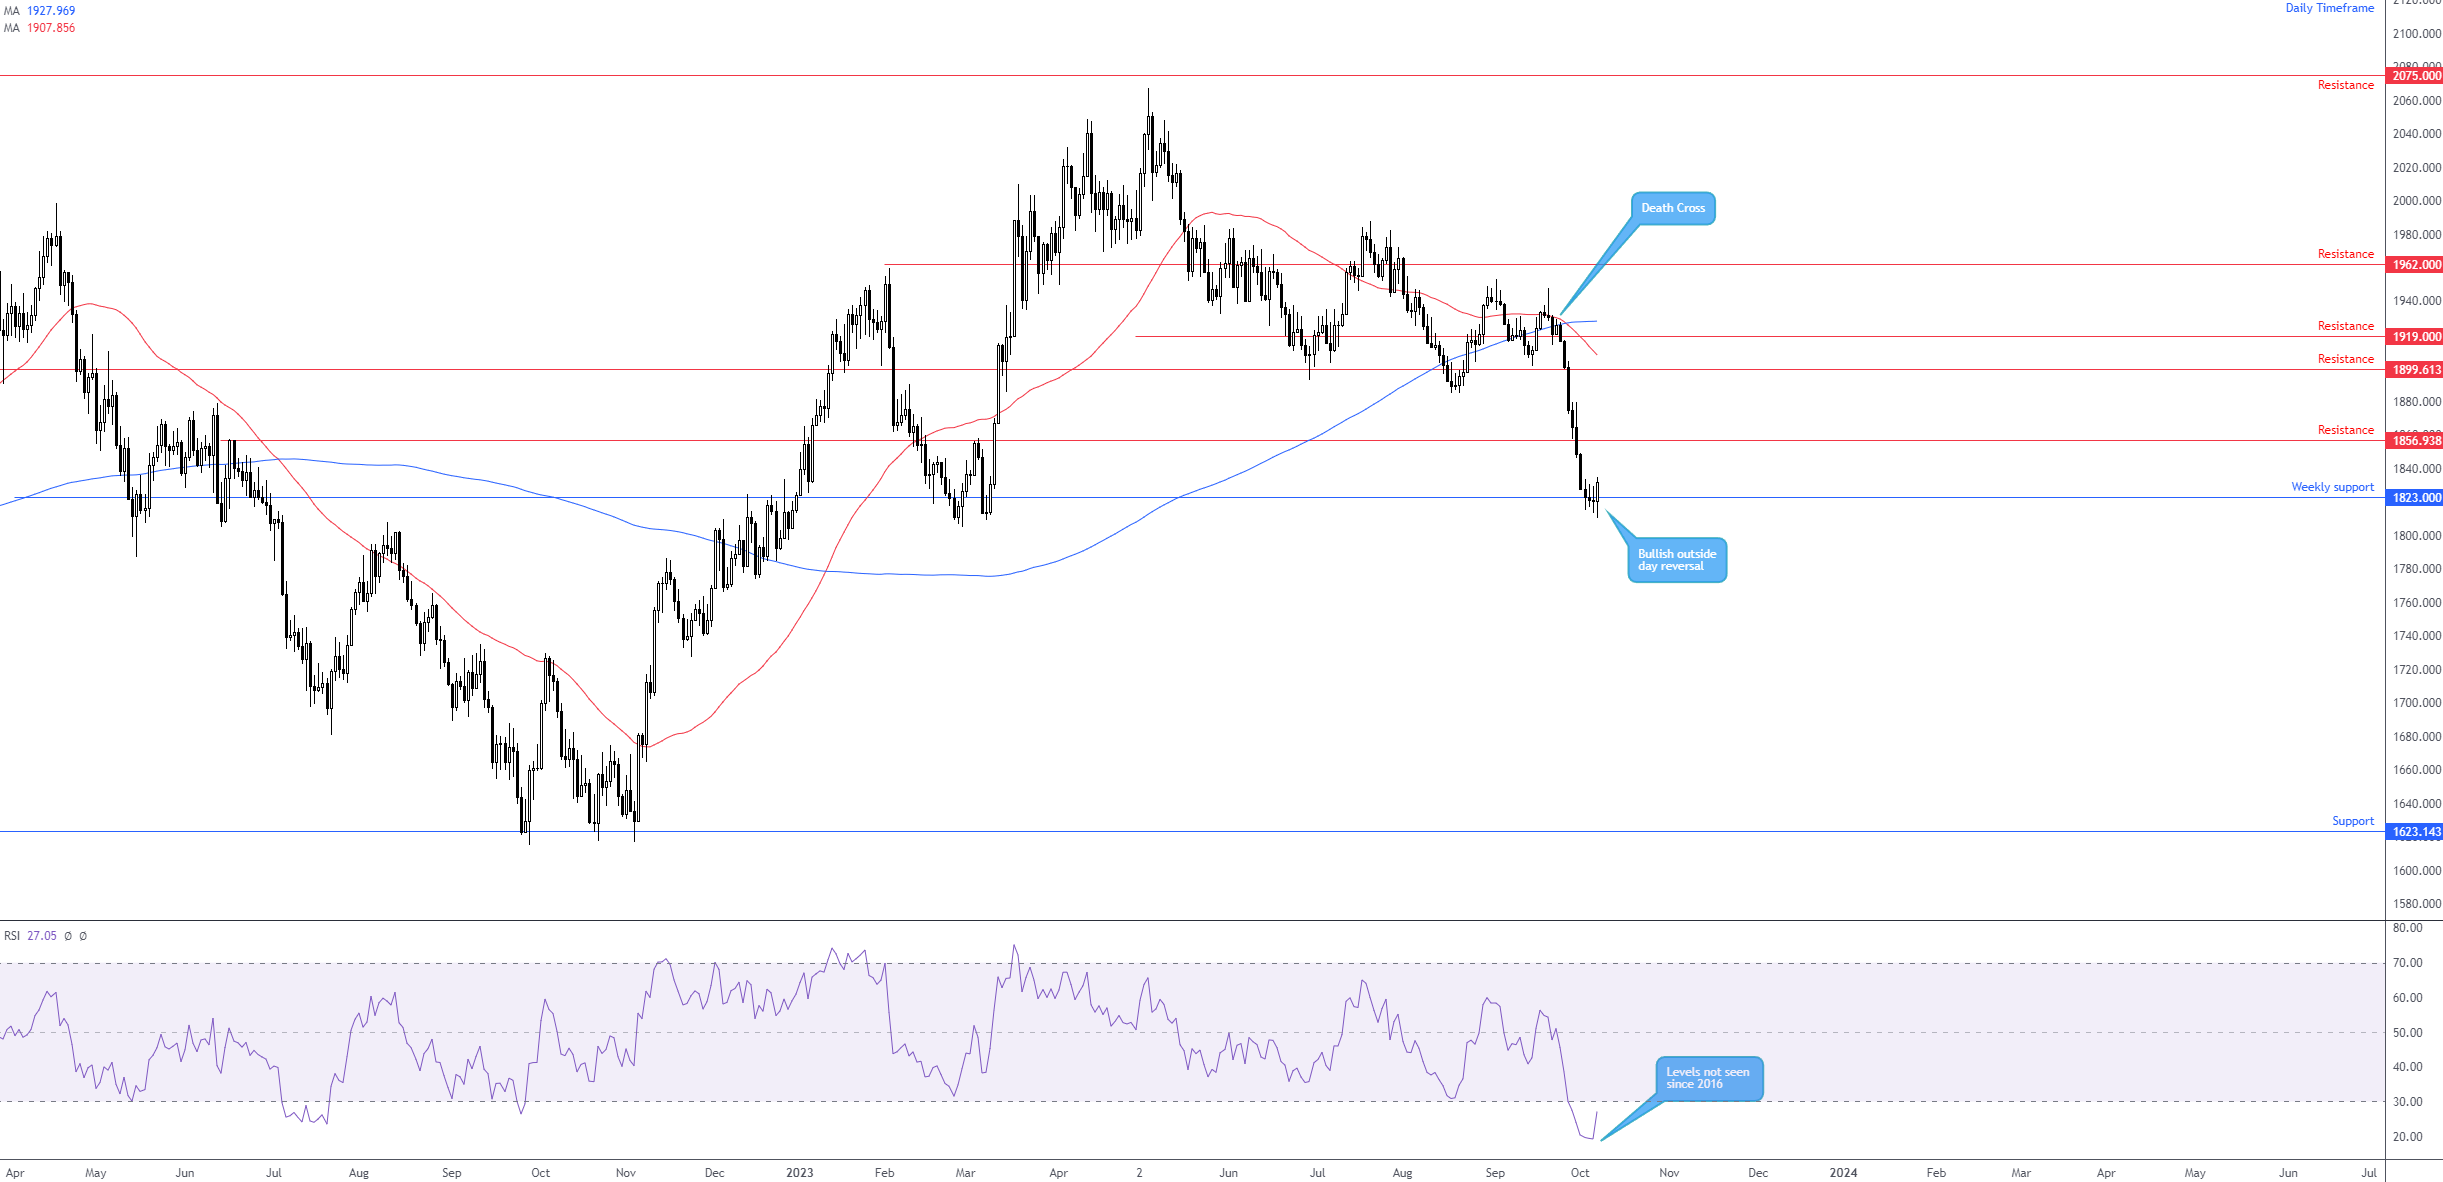
Adding to the weekly timeframe’s support at $1,823, the daily chart reveals Friday wrapped up in a distinct bullish outside day reversal. This is similar to a bullish engulfing formation, only it considers the upper and lower shadows, whereas a bullish engulfing focusses on the real body of the candles. Joining the bullish outside day reversal on the daily is the RSI bottoming deep from within oversold terrain (lowest levels since 2016) and closing in on exiting the area, which for some technical analysts would be viewed as a bullish cue and could see price action attempt to target daily resistance from $1,856 this week.
Charts: TradingView
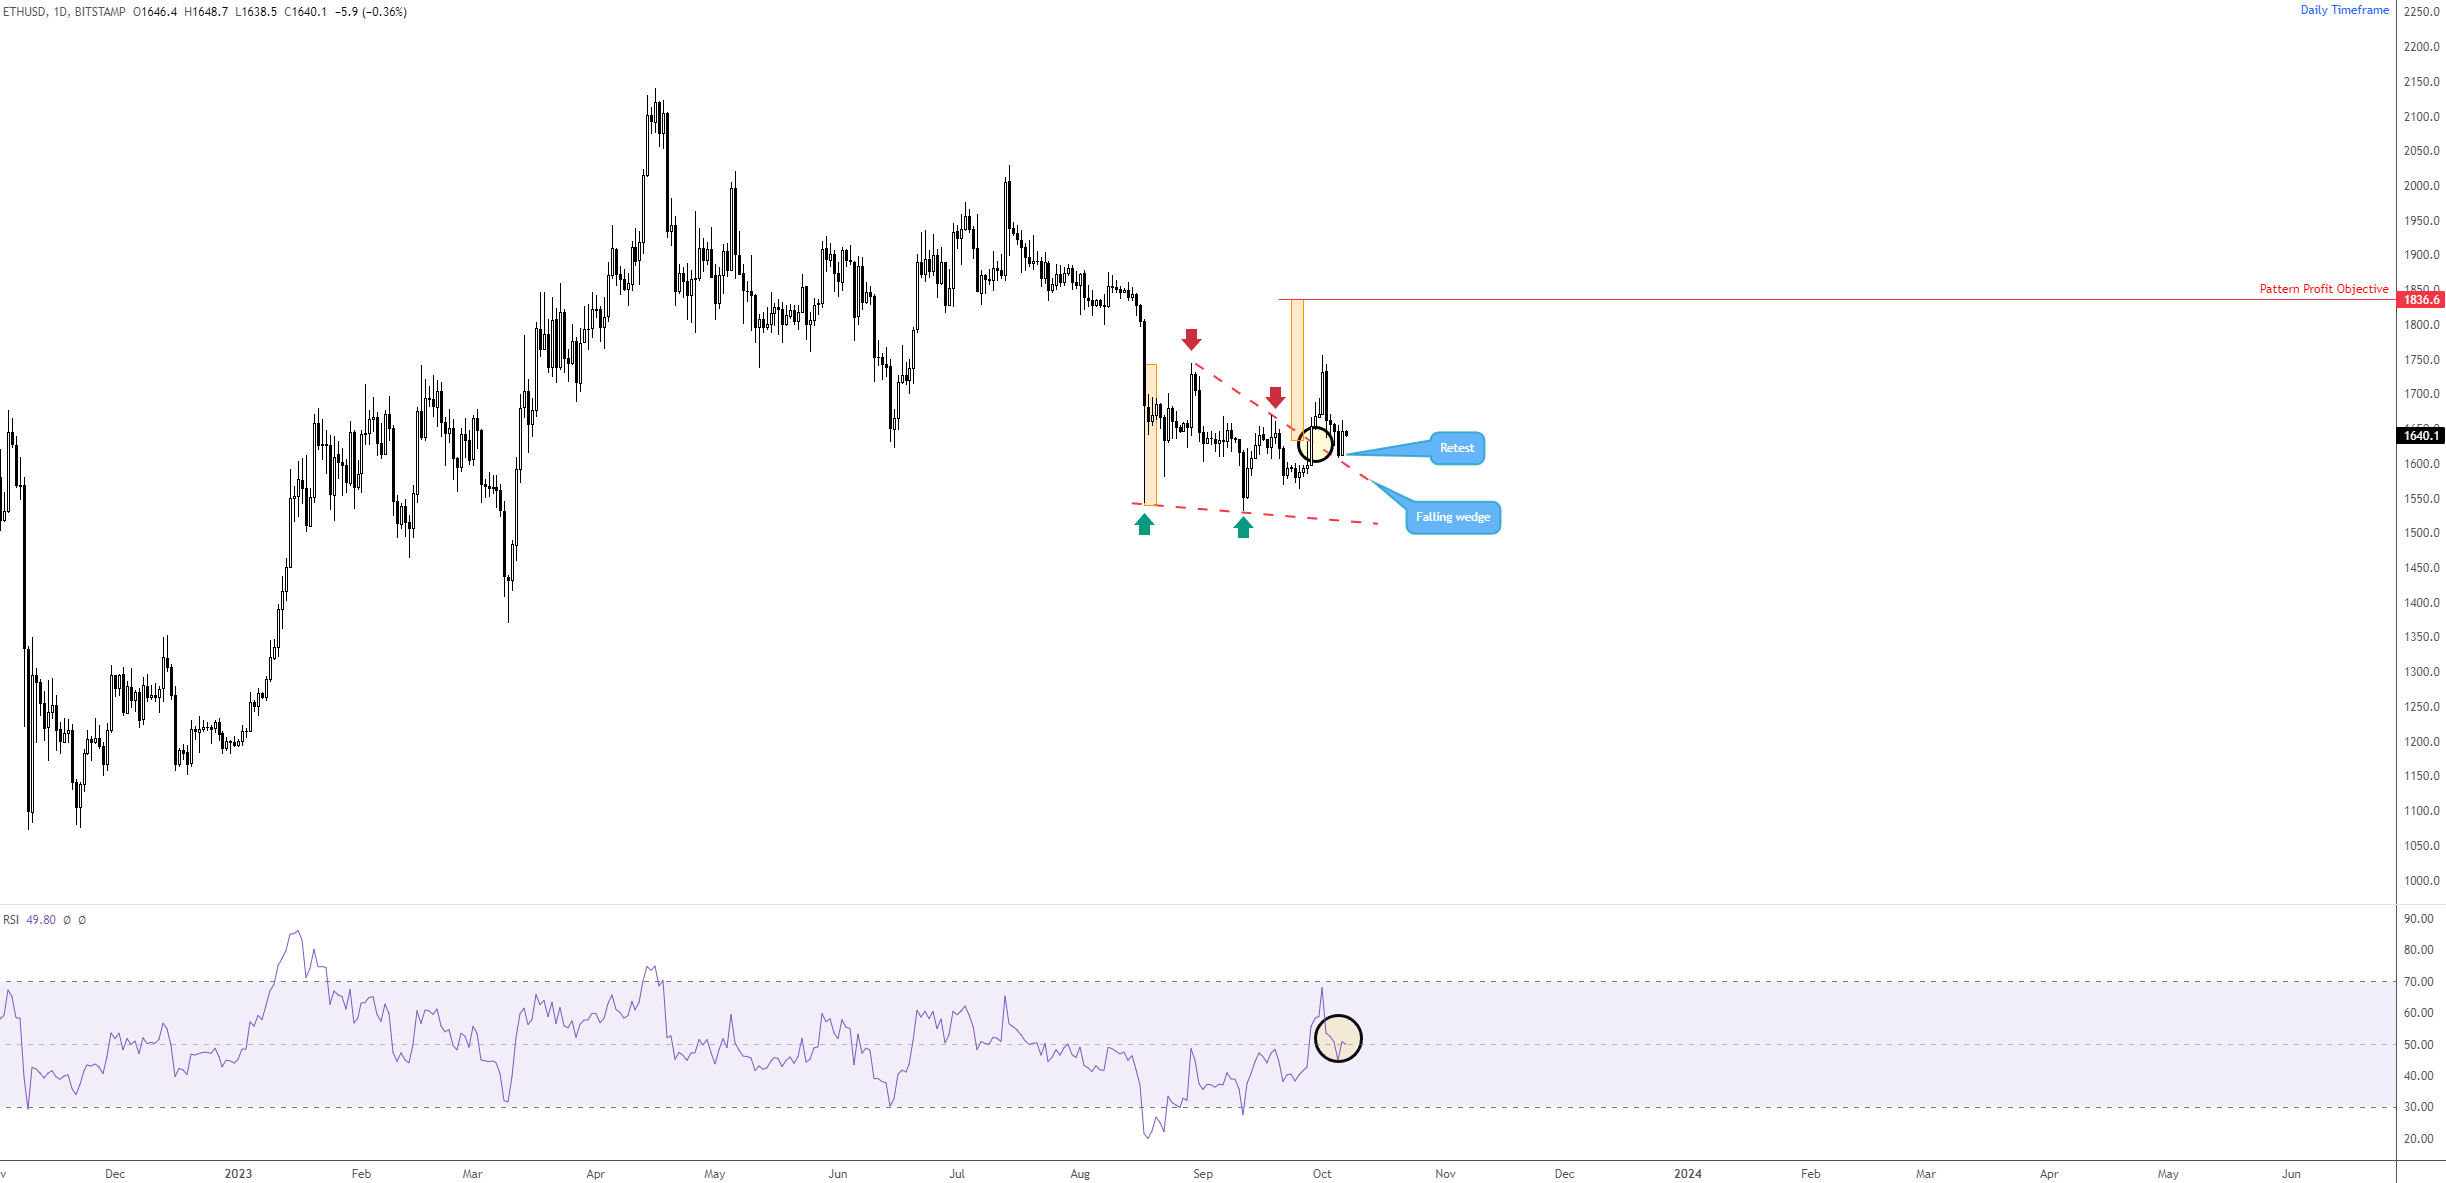
ETH/USD: Falling wedge pattern retest
Price action on the daily chart of ETH/USD ruptured the upper boundary of a falling wedge pattern in late September (drawn from the high of $1,744) and reached a high of $1,755 before pulling back and retesting the pattern’s upper limit.
With price now trending higher (seen through higher highs and higher lows) and the Relative Strength Index (RSI) testing the upper limit of its 50.00 centreline, could the retest of the upper boundary of the falling wedge be enough to draw in additional support and continue higher to the Pattern Profit Objective at $1,836?
Charts: TradingView
Author

Aaron Hill
FP Markets
After completing his Bachelor’s degree in English and Creative Writing in the UK, and subsequently spending a handful of years teaching English as a foreign language teacher around Asia, Aaron was introduced to financial trading,


