Weekly Market Brief: The S&P 500 index has a week down by -4.77%

Week that brought the major indices back to the strong support level that triggered the summer rally.
We believe the next few days can be very important to understand if those levels will resist, resulting in a bullish recovery, or will break in favour of further downside pressure.
Looking at specific indicators such as S5F
|
Financial index |
Current price* |
Forecast |
S1 |
R1 |
S2 |
R2 |
|---|---|---|---|---|---|---|
|
FTSE100 |
7,236 |
Consolidation |
7,150 |
7,500 |
7,000 |
7,630 |
|
FTSEMIB |
22,111 |
Cons./ Bullish |
20,700 |
23,650 |
20,000 |
25,000 |
|
DAX40 |
12,741 |
Cons./ Bullish |
12,840 |
14,000 |
12,000 |
14,460 |
|
S&P 500 |
3,873 |
Cons./ Bullish |
3,830 |
4,200 |
3,645 |
4,600 |
|
NASDAQ 100 |
11,861 |
Cons./ Bullish |
11,700 |
13,500 |
11,100 |
14,255 |
|
DOW JONES |
30,822 |
Cons./ Bullish |
30,600 |
33,300 |
30,000 |
35,100 |
|
TADAWUL |
11,829 |
Consolidation |
11,700 |
12,650 |
11,250 |
13,050 |
|
FTSE ADX |
10,201 |
Consolidation |
9,615 |
10,200 |
9,160 |
10,500 |
|
DFM |
3,489 |
Consolidation |
3,270 |
3,500 |
3,100 |
3,730 |
|
Indicator |
Current price |
Forecast |
S1 |
R1 |
S2 |
R2 |
|---|---|---|---|---|---|---|
|
VIX index |
23.61 |
Consolidation |
20,00 |
35,00 |
11,00 |
41,00 |
|
US dollar index (DXY) |
109,643 |
Cons./ Bearish |
105,00 |
110,50 |
103,00 |
114,00 |
|
US10 years yield |
3.451% |
Cons./ Bearish |
2.900% |
3.500% |
2.500% |
3.650% |
|
S5FI* |
24.25 |
Cons./ Bullish |
40 |
80 |
30 |
90 |
We are now in an area where the risk /reward is in favour of an upside rather than a bearish continuation.
DXY and US10 are very extended to the upside and their possible retracement could give the markets some relief.
Given the positioning on strong supports and the generalised extension of internal indicators, we are in favor of a recovery but we are waiting for a price confirmation.
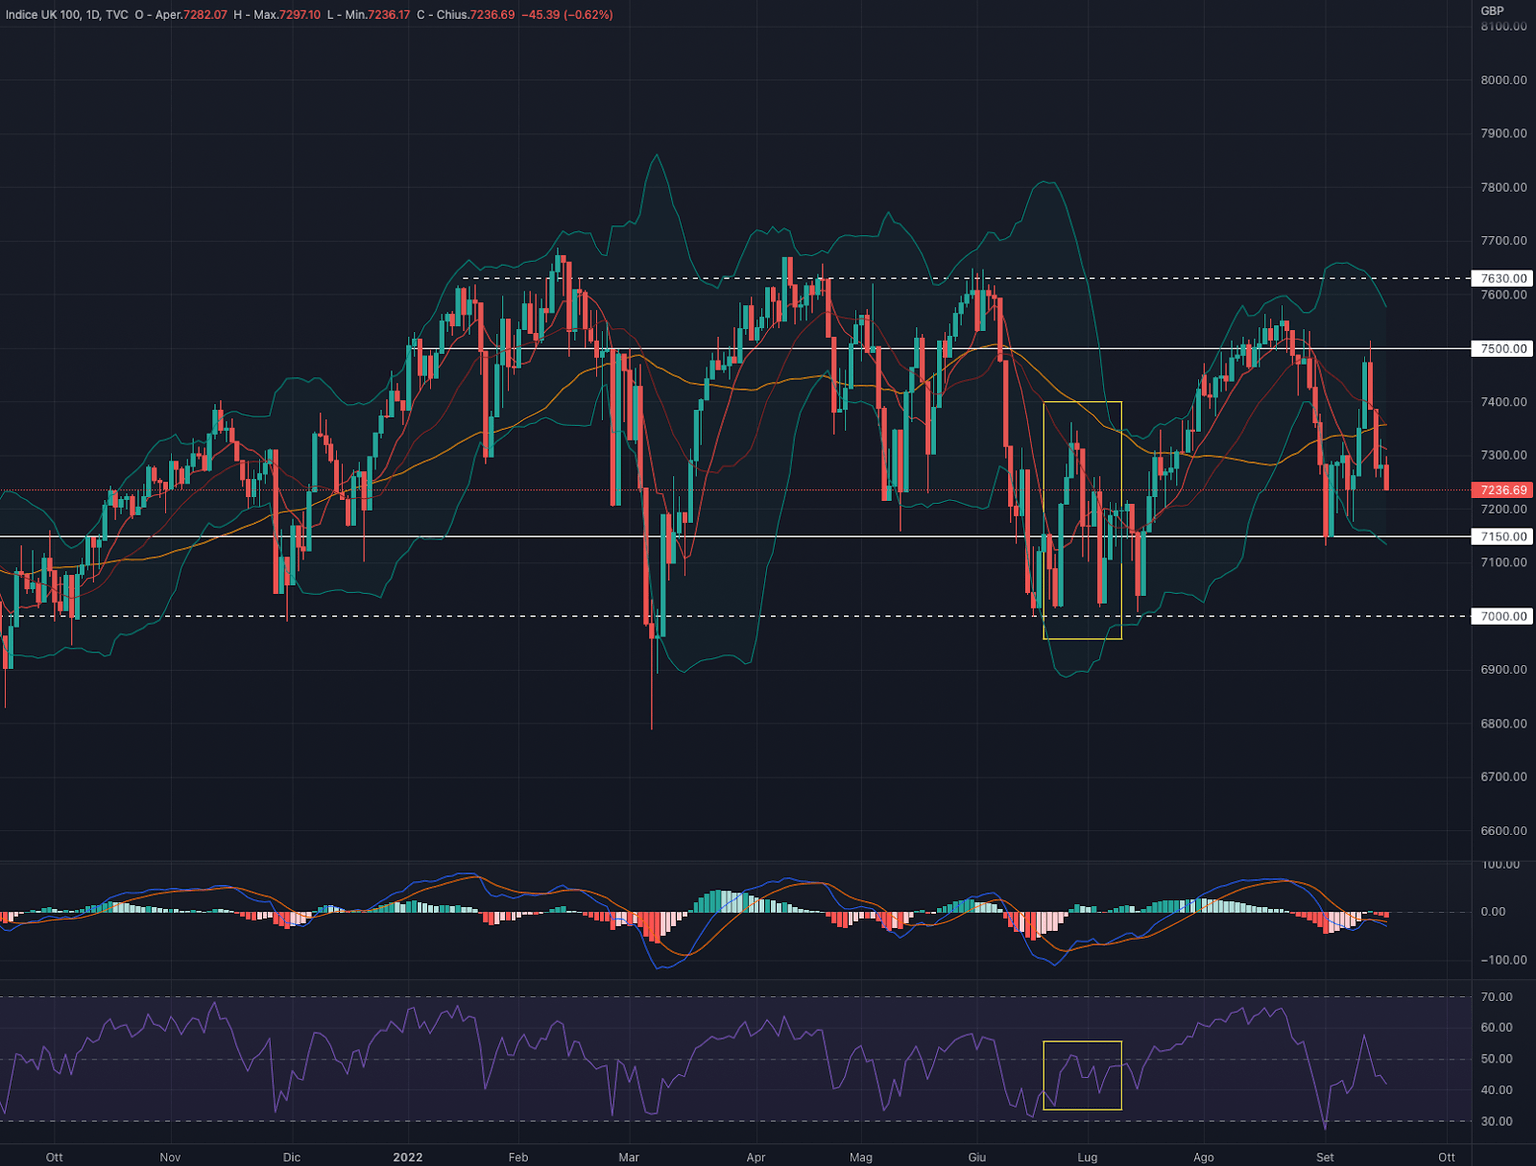
FTSE 100 (UKX)
The FTSE100 index had a week down by -1.56%
For the coming week we are in favour of a consolidation in the area of 7.230 - 7.330
Indicators
Relatively quiet week for the British index, especially when to its peers.
The price seems to want to consolidate well above the strong support at 7.150: if this hypothesis turns out to be true, it would be a very positive figure in the short-medium term.
|
Current price |
Forecast |
S1 |
R1 |
S2 |
R2 |
|---|---|---|---|---|---|
|
7,236 |
Consolidation |
7,150 |
7,500 |
7,000 |
7,630 |
MACD and RSI, however, leave us slightly skeptical about the possibility of a short-term extension as they are both in negative territory.
We point out the strong depreciation of GBP / USD which positively impacted the week's performance.
We prefer to remain neutral on the FTSE100 and await the break of one of the levels at 7.230 or 7.330
Support at 7,150
Resistance at 7,500
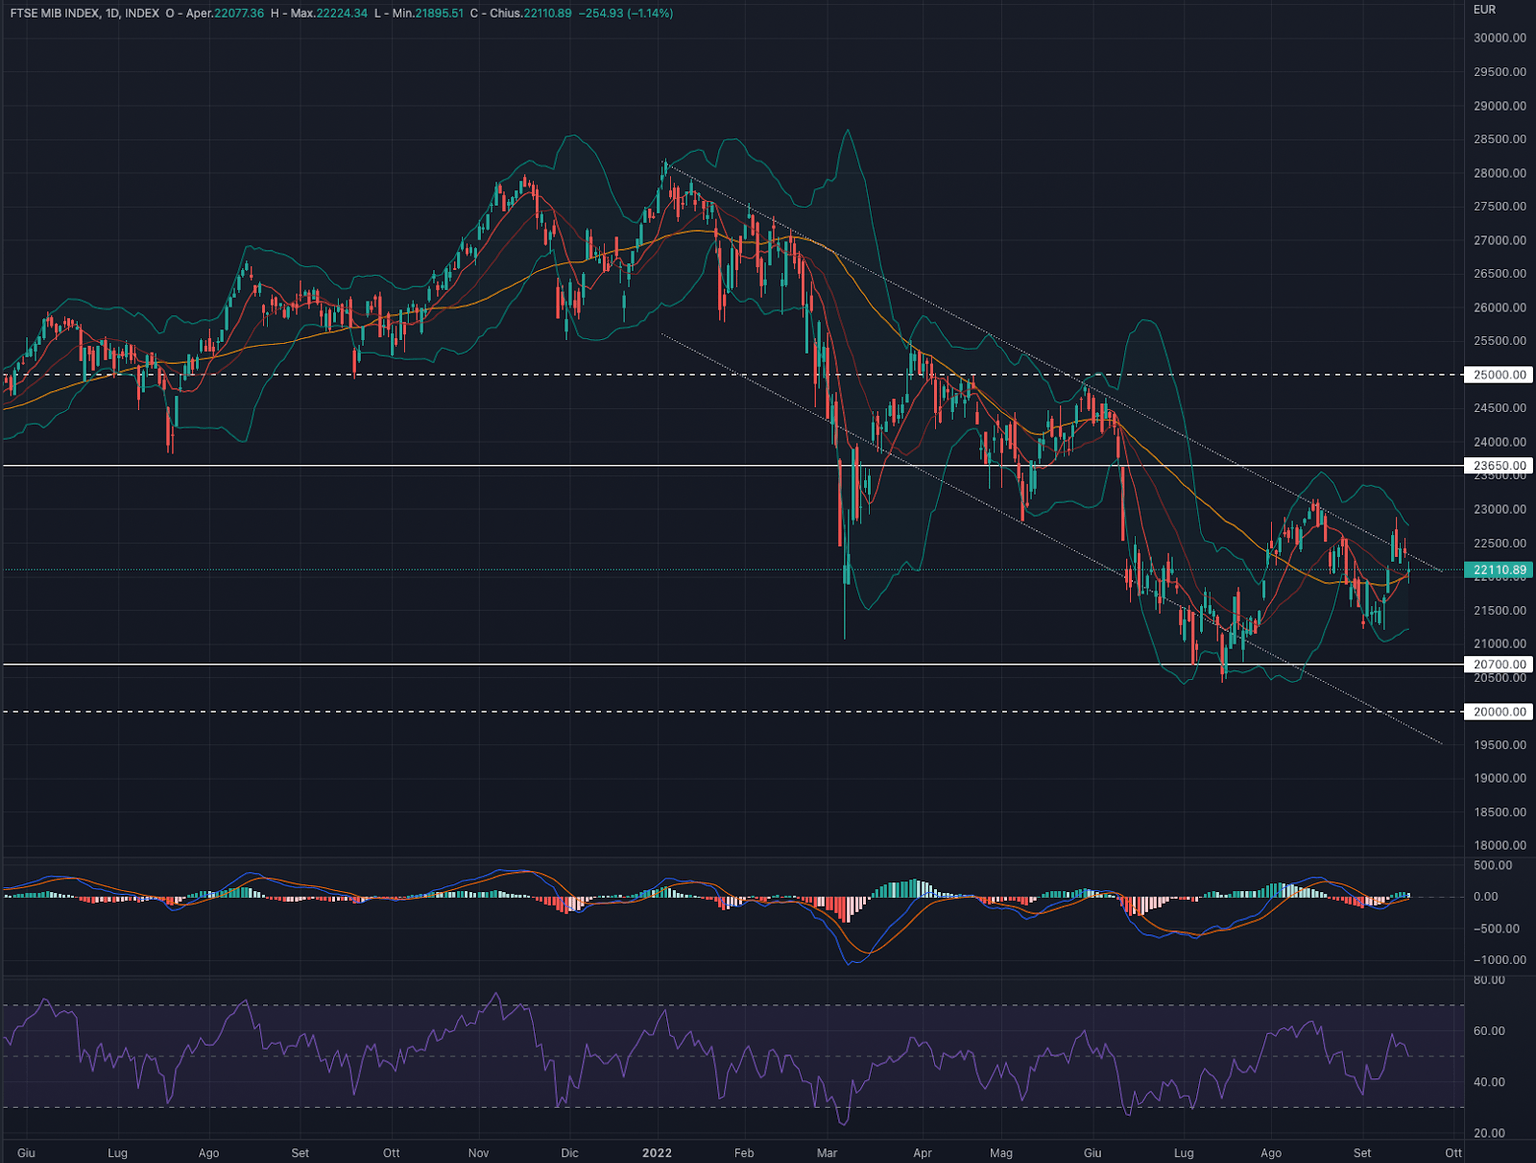
FTSEMIB (FTSEMIB)
The FTSEMIB index had a week up by +0.07%
For the coming week we are in favour of a consolidation in the area of 22,000 - 22,500
Indicators
Consolidation week for the Italian index which we believe may be close to a strong price in the short term in both directions.
MACD and RSI are also fairly neutral as the first is at the 0 level and the second at 50.
While we believe that the recovery that
|
Current price |
Forecast |
S1 |
R1 |
S2 |
R2 |
|---|---|---|---|---|---|
|
22,111 |
Cons./ Bullish |
20,700 |
23,650 |
20,000 |
25,000 |
took place in July is very positive in the medium term, we believe it is appropriate to wait for a price confirmation.
The price action from June till today has begun a progressive narrowing that will lead to a break up of the level of 22.500 or a fall of 21.500.
At the moment we prefer to remain neutral on the FTSEMI and act accordingly on the break of one of the two levels.
Support at 21,500
Resistance at 23,650
DAX 40 (DAX)
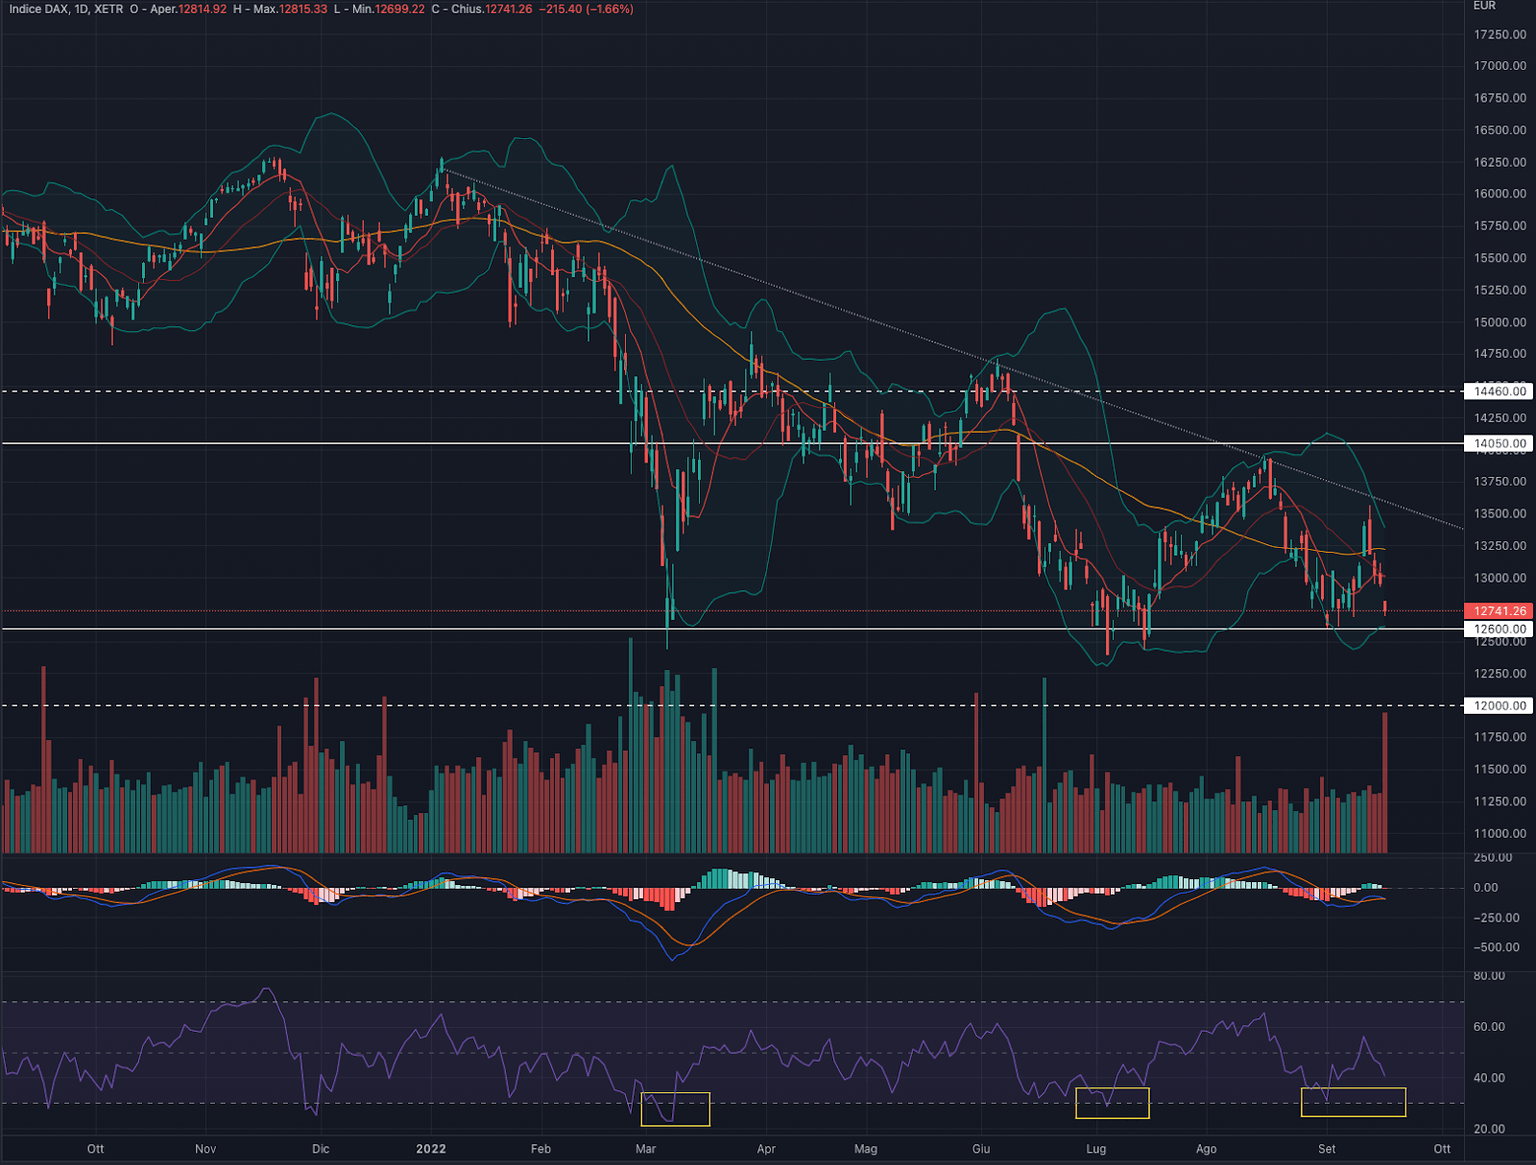
The DAX index had a week down by -2.65%
For the coming week we are in favour of a possible recovery to at least 13,100
Indicators
Week that sees once again respecting the strong bearish trend line that started in January 2022.
The price is now near the strong support at 12.600 which we believe will once again play the role of a reversal area.
|
Current price |
Forecast |
S1 |
R1 |
S2 |
R2 |
|---|---|---|---|---|---|
|
12,741 |
Cons./ Bullish |
12,840 |
14,000 |
12,000 |
14,460 |
MACD and RSI are both negative but we can see a positive divergence with the price action when this reached the support at 12.600.
We are currently still neutral on the DAX and in the process of considering long setups once we break above 13,250
Support at 12,600
Resistance at 14.050
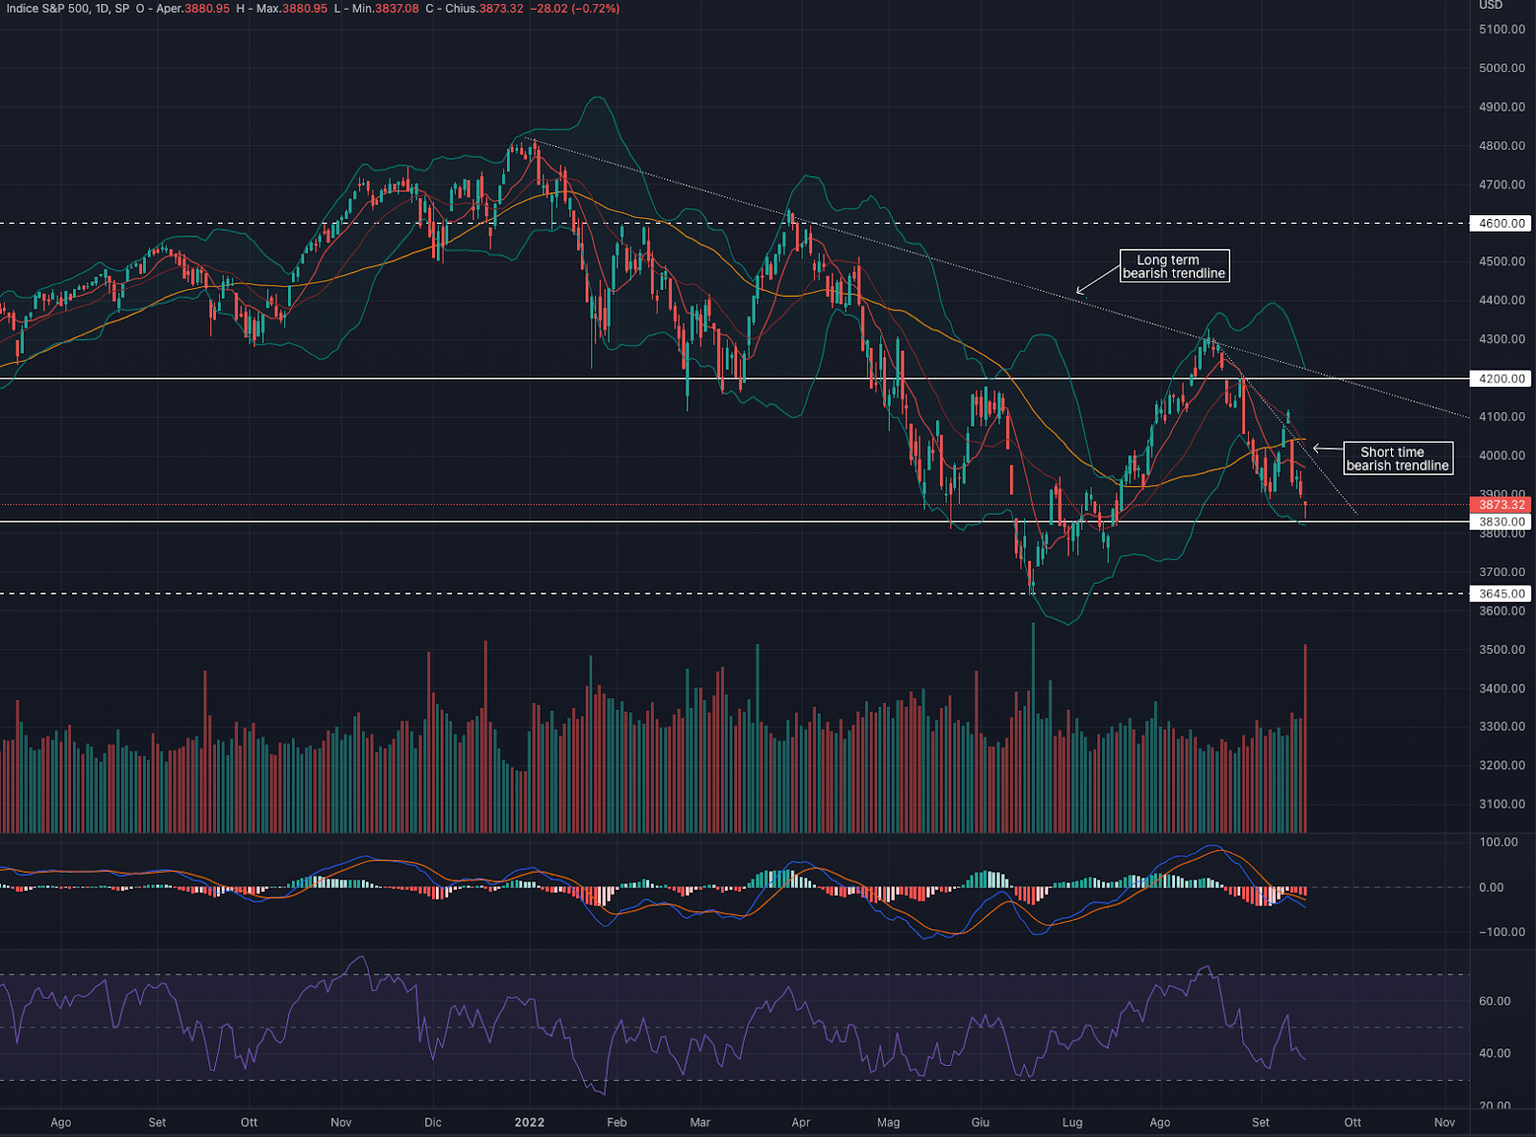
S&P 500 (SPX)

The S&P500 index had a week down by -4.77%
For the week ahead, we are in favour of a possible recovery to at least 3,900-4,000
Indicators
Week that saw the index test again the strong support at 3.830. Given the strong downward extension and nearing the bottom of the Bollinger Band, we believe there may be a short-term recovery of vigour.
MACD and RSI perfectly describe the bearish period of the index with the first below 0 and the second well below the 50 threshold.
To understand when the price can begin the long-awaited upward recovery, we believe it is appropriate to rely on the breakdown of the bearish trendlines present on the index: the first we identify starting from August 16 (short term) and the second starting from January 2022 ( long period).
|
Current price |
Forecast |
S1 |
R1 |
S2 |
R2 |
|---|---|---|---|---|---|
|
3,873 |
Cons./ Bullish |
3,830 |
4,200 |
3,645 |
4,600 |
At the moment we remain neutral on the S&P500 and ready to consider long setups at the break of the short-term bearish trendline, which could come with a consolidation above 4,000
Support at 12,600
Resistance at 14,050
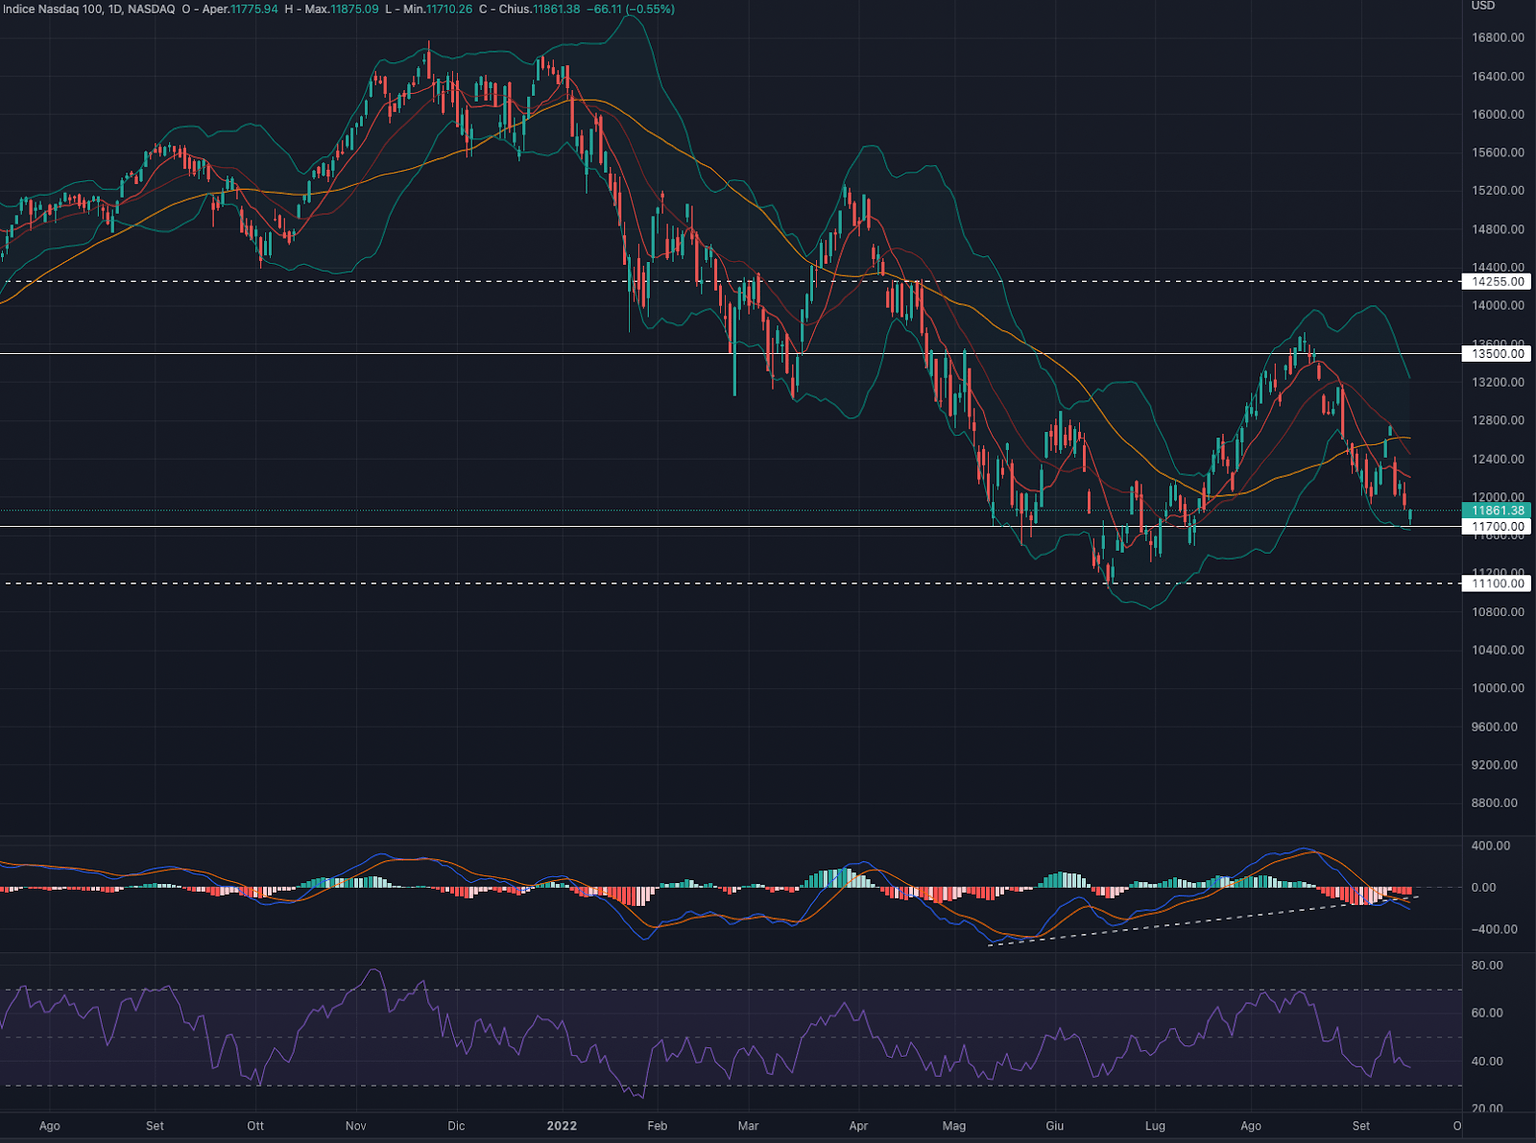
NASDAQ 100 (NDX)
The NASDAQ 100 index had a week down by -5.77%
For the coming week we are in favour of a possible recovery to at least 12,200
Indicators
Week that saw the Tech index being rejected by the 50-day moving average (yellow line) which once again confirms the negative period.
Taking into account the price again started in May 2022 we can see a substantial lateral fluctuation of the NDX: having said that, and combined with the reaching of the lower part of the Bollinger band, we can expect a slight bullish recovery in the short term.
|
Current price |
Forecast |
S1 |
R1 |
S2 |
R2 |
|---|---|---|---|---|---|
|
11,861 |
Cons./ Bullish |
11,700 |
13,500 |
11,100 |
14,255 |
MACD and RSI confirm the bearish period as they are both in negative territory: to be monitored if the former will remain above the bullish trendline began in May 2022.
We remain neutral on the Nasdaq 100 stressing the momentary situation of uncertainty. It may be worth considering long setups in case, by the end of next week, the price would manage to close above the 12,000 level.
Support at 11,700
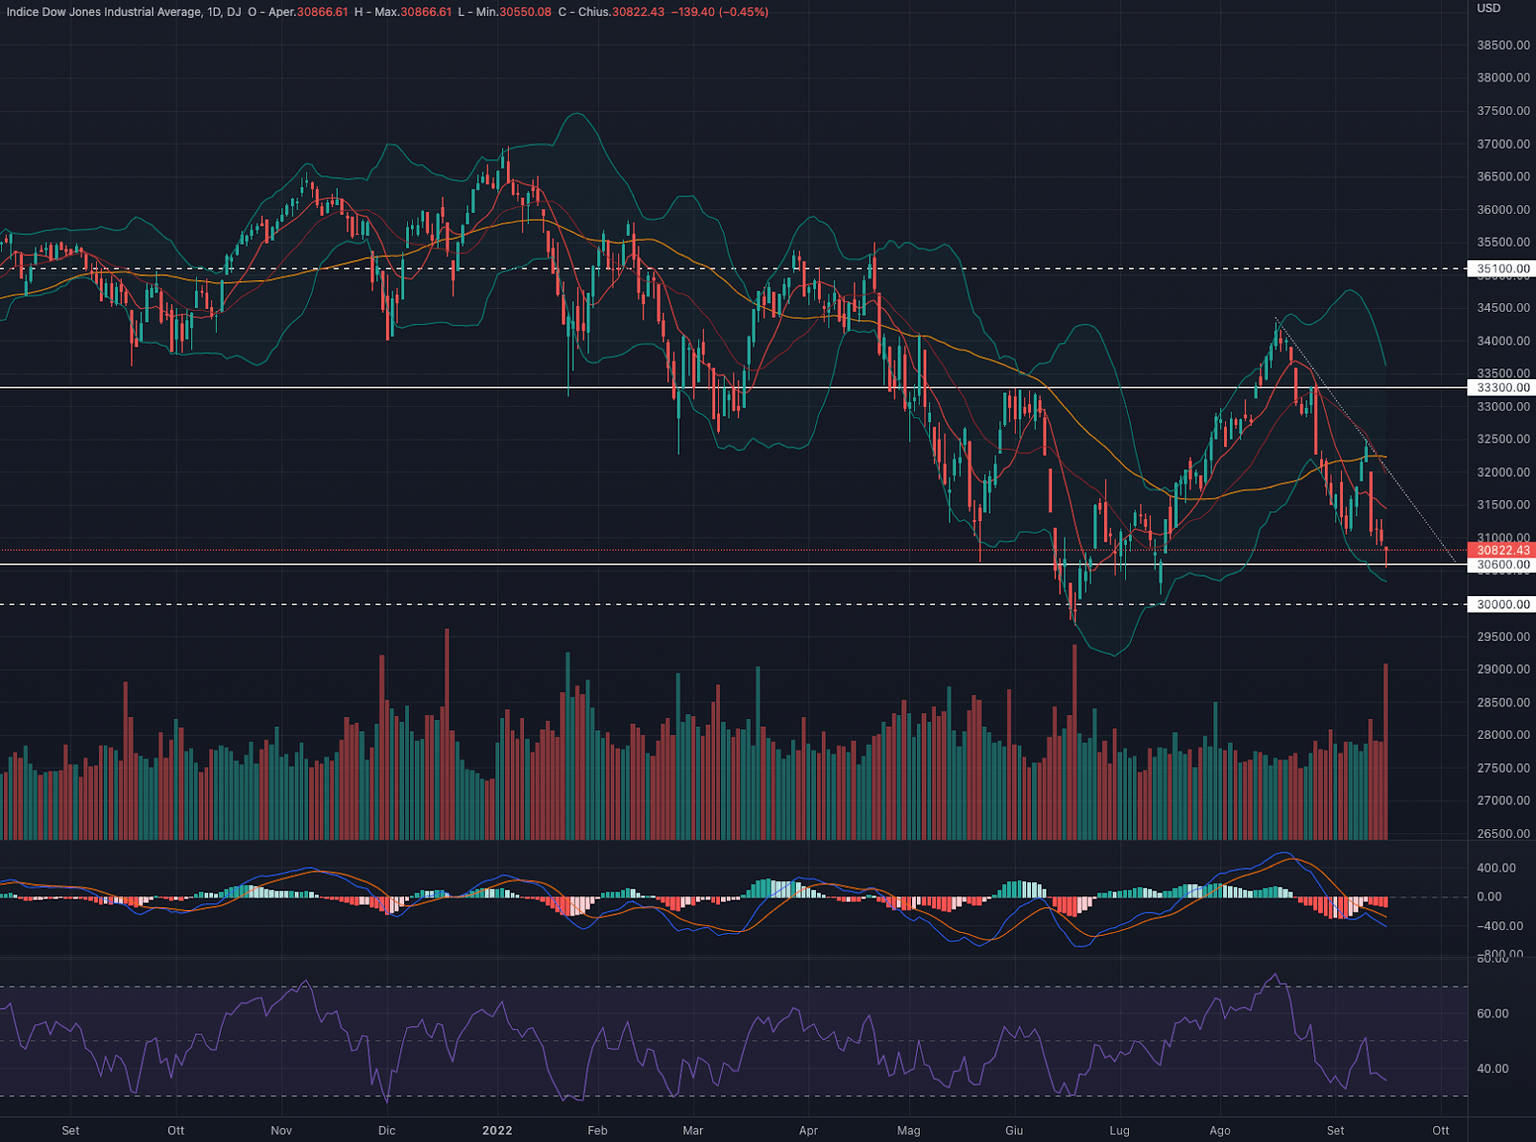
DOW JONES (DJI)
The DOW JONES index had a week down by -4.13%
For the coming week we are in favour of a possible recovery to at least 31,500
Indicators
Week that brings the American index back to the strong support at 30.600 which has played few times the role of an upside reversal area.
Although the trend remains downward, it is desirable to expect a recovery of strength in the short term given the concomitance of the strong support, the lower level of the Bollinger band and a desirable Friday's reversal candle.
|
Current price |
Forecast |
S1 |
R1 |
S2 |
R2 |
|---|---|---|---|---|---|
|
30,822 |
Cons./ Bullish |
30,600 |
33,300 |
30,000 |
35,100 |
The short-term bearish trendline, which began in August 2022, confirms that only a break of the 31.500 level could then lead to a subsequent much more marked recovery.
MACD and RSI confirm the negative period of the index, both finding themselves in bearish territory
We remain neutral on the Dow Jones and ready to consider long setups once the 31.500 level has passed.
Support at 30,600
Resistance at 33,300
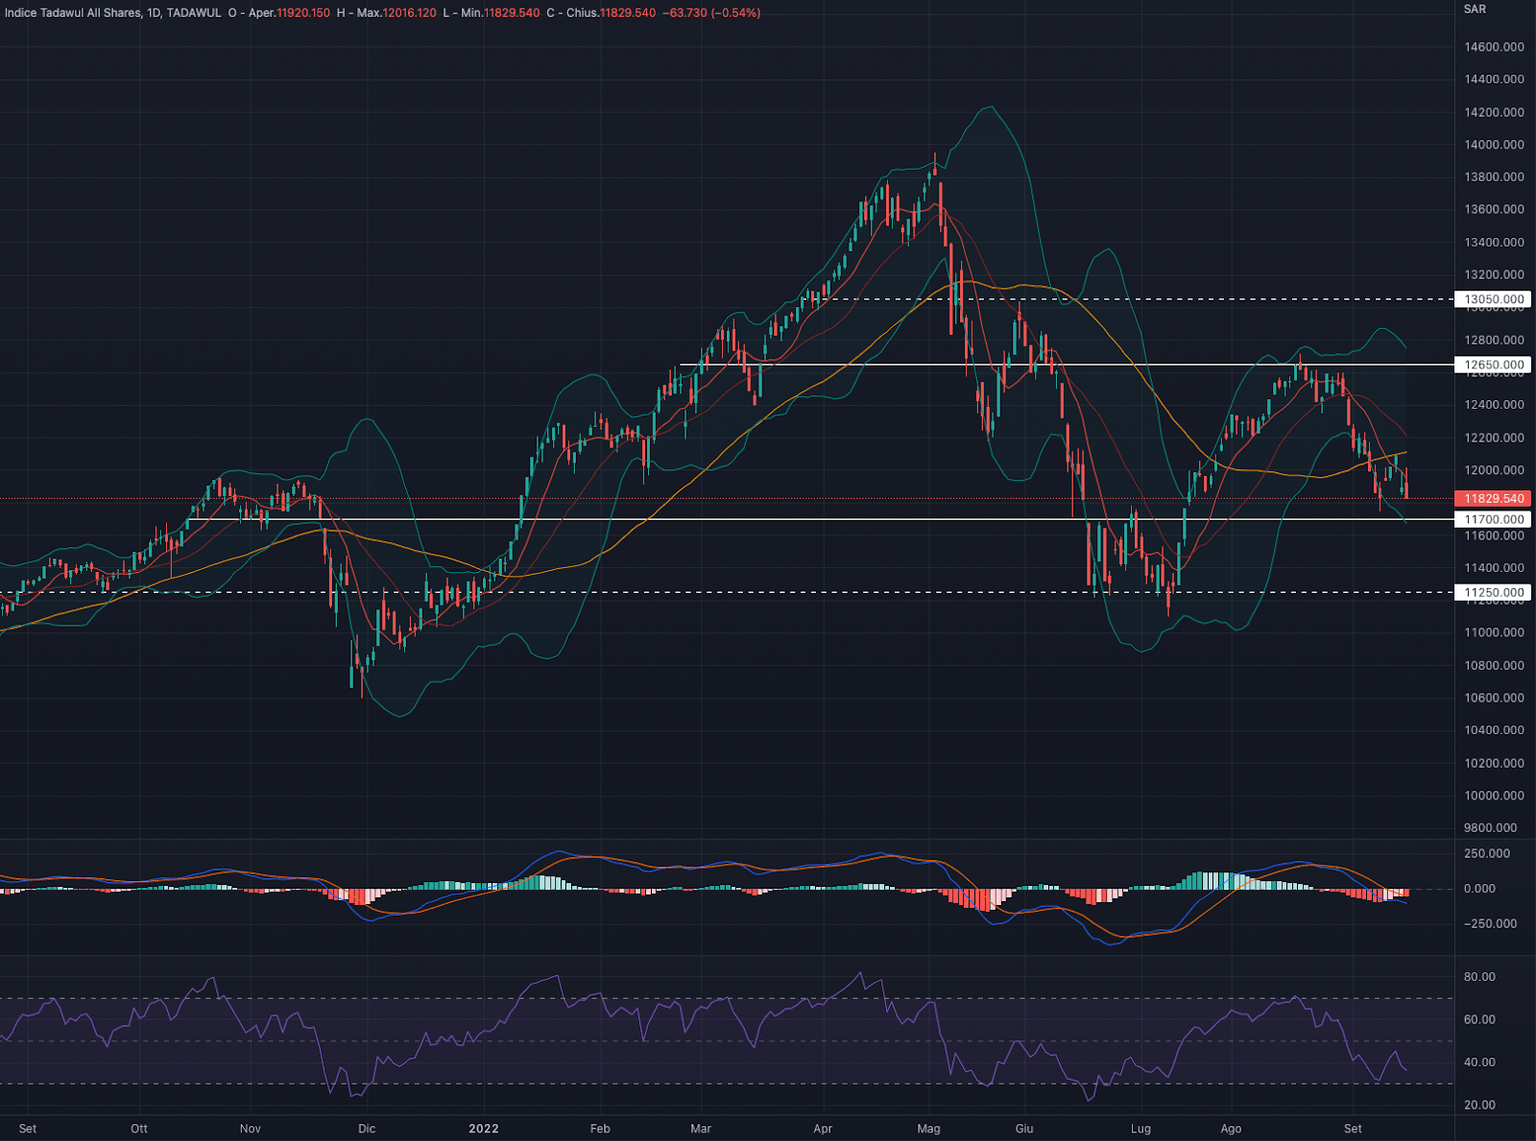
TADAWUL (TASI)
The TADAWUL index had a week down by -0.04%
For the coming week we are in favour of a consolidation in the area of 11.770 - 12.080
Indicators
Week of substantial consolidation for the Saudi index. The price is on the verge of strong support at SAR 11.700 and a scenario like that of June 2022 is a possibility.
MACD and RSI fully describe the uncertainty scenario with the former below the 0 level (negative momentum) and the latter still below 50 (bearish).
|
Current price |
Forecast |
S1 |
R1 |
S2 |
R2 |
|---|---|---|---|---|---|
|
11,829 |
Cons./ Bullish |
11,700 |
12,650 |
11,250 |
13,050 |
Looking at previous price action, the recent drop below the 50-day moving average (yellow line) does not suggest a possible price recovery in the short term.
At the moment we prefer to remain neutral on the TADAWUL to understand if the price will be able to consolidate in the area of 11.500 - 11.700: a similar scenario could in fact offer interesting long setups.
Support at 11,700
Resistance at 12,650
FTSE ADX GROWTH MARKET INDEX (FADGI)
The FTSE ADX index had a week up by +/- 0.00%
For the coming week we are in favour of a consolidation in the area of 9.950 - 10.115
Indicators
Positive week that brings back the index close to the strong resistance at AED 10,200
The trend reversal that took place on 7 September is very positive with the view of a bullish continuation, at the same time we should not exclude a possible retracement after the most recent upsides.
MACD and RSI are positive and seem to support the adva
|
Current price |
Forecast |
S1 |
R1 |
S2 |
R2 |
|---|---|---|---|---|---|
|
10,201 |
Consolidation |
9,615 |
10,200 |
9,160 |
10,500 |
nce of the index: the first has crossed the 0 line (bullish momentum) and the second is near the level of 60.
It is in particular the RSI that makes us remain cautious on the index and await a slight retracement: as happened in the past, reaching this level has often led to a subsequent drop in price.
At the moment we prefer to remain neutral on the FTSE ADX: while the mere price action is very positive, we believe that some internal indicators may signal a possible short-term weakness.
Support at 9,615
Resistance at 10,200
DUBAI FINANCIAL MARKET GENERAL INDEX (DFMGI)
The DFM index had a week up by +3.82%
For the coming week we are in favour of a consolidation in the area of 3,400
Indicators
Positive week that brings back the index close to the strong resistance at AED 3,745
The fact that the price continues to remain above the 50-day moving average (yellow line) is certainly a very important aspect in the short-medium term.
MACD and RSI are positive but signal a negative divergence with the price action starting from mid-August 2022. During this period, if on the one hand we witnessed a substantially flat price, on the other we saw a gradual weakening of internal indicators.
|
Current price |
Forecast |
S1 |
R1 |
S2 |
R2 |
|---|---|---|---|---|---|
|
3,489 |
Consolidation |
3,270 |
3,500 |
11,250 |
13,050 |
Weakening which, in our opinion, could put on hold a possible break to the upside of the resistance level at AED 3,475.
At the moment we prefer to remain neutral on the DFM: while the mere price action is very positive, we believe that some internal indicators may signal a possible short-term weakness.
Support at 3,270
Resistance at 3,475
Author

Francesco Bergamini
OTB Global Investments
Francesco, BSc Finance and Msc in Business Management, graduated with Merit, is a professional with experience in the financial services industry and a keen interest in the financial markets.
