Weekly column: Will the stars align for a market crash?
Review
Wall Street’s climb to record highs has come with conspicuously little volatility. The S&P 500 has gone 377 days without a 2.05% sell-off. That’s the longest stretch for the benchmark since the great financial crisis, according to FactSet data compiled by CNBC. The index hasn’t experienced a gain of at least 2.15% in that time either.
— Brian Evans, “The Stock Market Is in Its Longest Stretch Without a 2% Sell-Off Since the Financial Crisis,” www.cnbc.com, June 21, 2024.
The 21% U.S. corporate tax rate is the biggest single variable in the sprawling 2025 tax debate, and the two parties are trying to turn that dial in opposite directions with major consequences for companies’ profits and federal revenue. The rate could climb as high as 28% if Democrats sweep November’s elections and move as low as 15% if Republicans gain full power.
— Richard Rubin, “Corporate Tax Rate Spurs Political Fight With More Than $1 Trillion at Stake,” Wall Street Journal, June 17, 2024.
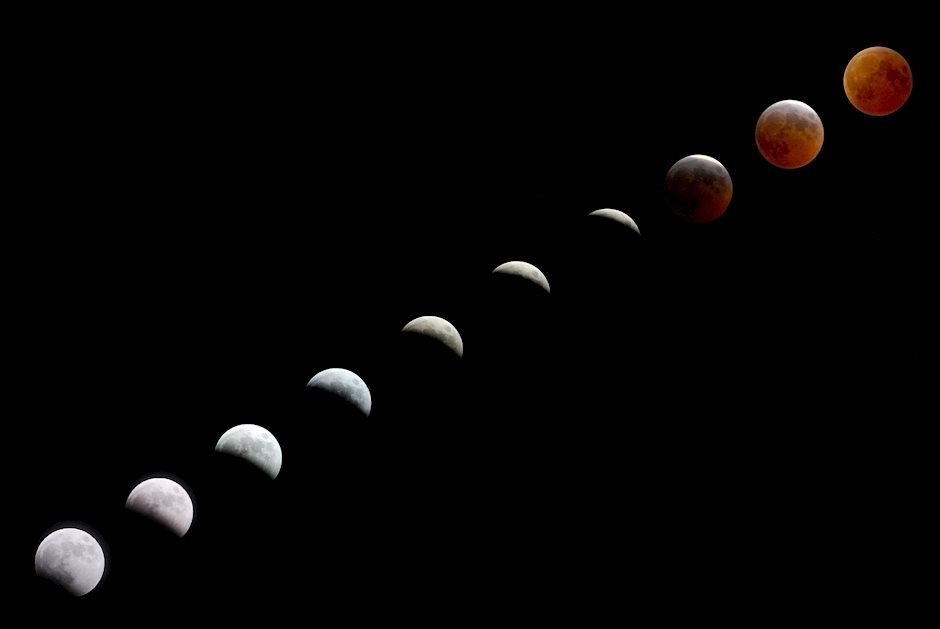
You don’t see a Full Moon on the summer solstice very often. But it happened this past week, and as the seasons change during the current Full Moon, financial markets may also be setting up for a change of trend.
Both a change of season and a Full Moon are often associated with sudden changes of trend, although most of the time, these trend changes are short-lived. However, since it is getting late in the cycles of some markets, such as stocks, any change of trend is liable to last longer than just a few days. The later a bull market is in its cycle, the more vulnerable it is to a sudden reversal to the bottom of that cycle. In the case of U.S. stocks, we note that it is very late in their 4-year cycles. In fact, in only two cases in the last 130 years, the four-year U.S. stock market cycle topped out past the 49th month after it began. June 2024 is now 51 months following the 4-year cycle low of March 2020.
Most of the world’s stock indices are mired in congestion over the past two months. The notable exceptions are the NASDAQ and S&P in the U.S. and the NIFTY index of India, which each made new all-time highs late last week. China’s Shanghai Composite may be an exception, too, because on Friday, it dropped to its lowest level in five weeks. Still, divergences continue to mount as these few indices make new all-time highs unconfirmed by new all-time highs in other indices in their region.
As mentioned above, this is a concern because it is late in their longer-term cycles, and divergences like this are often bearish signals. It’s as if a storm is forecasted, and the clouds are beginning to gather on the horizon. Plus, we are moving from soft, harmonious aspects of Jupiter to Uranus, Neptune, and Pluto between April and June and into a 9-month series of hard, square aspects from Jupiter to Saturn starting in August. With Jupiter in the air sign of Gemini now, the winds of change could soon pick up their force.
Gold and Silver were interesting again as both had smart rallies all week that suddenly ended on Friday. This was yet another score for the new MMA Solar/Lunar Reversal App, which issued a buy signal in Gold from a low that in Gold on June 13 (when it dropped to 2310.90) and then a sell signal from a high on June 21 that was met as prices reached 2382.60, the weekly high. By the close on Friday, Gold was near 2330. However, we have another buy indicator arising in the next 10 days as we approach Neptune turning retrograde (see below).
In other markets, Crude Oil soared to a new multi-week high of 81.78 on Friday, confirming its primary cycle trough at 72.40 on June 4. Bitcoin, on the other hand, exhibited weakness, dropping to a low of 63,274 on Friday. It’s nearing important support as Saturn turns retrograde, conjoining Uranus in BTC’s first trade chart next weekend. Its orb of influence is already in play.
Short-term geocosmics
Home prices rose in May to a new high, with low inventory continuing to spur bidding wars among home buyers in some markets…. Those high prices, paired with elevated mortgage rates, have limited the number of sales this spring—typically the busiest season for home buying. Sales of previously owned homes decreased 0.7% from the prior month, the third straight monthly decline. On an annual basis, existing-home sales, which make up most of the housing market, fell 2.8%. Even though demand is low, home prices are still rising because high mortgage rates are deterring potential sellers from listing their homes, keeping the supply of homes on the market lower than normal.
—Nicole Friedman, “Home Prices Hit a Record High,” www.wsj.com, June 21, 2024.
We now switch seasons, literally.
If you live in the northern hemisphere, this is the period of the longest days of the year and is known as the summer solstice. It also begins the sun sign of Cancer in Western Astrology, which traditionally rules the home and family, and by extension, the nurturing and protection of loved ones, or even country, as in patriotism. Cancer is a water sign that pertains to emotions, as opposed to Gemini, the sun sign we are leaving, which is an air sign and hence more cerebral.
Cancer’s nature is also defensive rather than offensive. A more pronounced offensive focus is due in the following month when we enter the fire sign of Leo on July 22. For now, investors (and people in general) may lean more toward being defensive in their approach to finances, politics, and all relationships (professional or personal).
The defensive posturing of investors may be heightened this week as first Saturn and then Neptune turn retrograde, on June 29 and July 2, respectively. Saturn, like Cancer, is more cautious and careful in judgment than most signs. It is less aggressive by nature, more like a wall that resists force. Thus, when Saturn is highlighted, many markets may be in the process of making lows in price. If, instead, they are making highs, then something may trigger investors’ fears of loss (or loss of profit), and thus selling begins and markets reverse to the downside. Saturn stations (retrograde and direct dates) have proven to be very strong reversal signals, especially when primary cycles (highs or lows) are due within an orb of ten trading days.
Neptune retrograde is also a strong reversal signature. In fact, in our studies published in The Ultimate Book on Stock Market Timing Volume 3: Geocosmic Correlations to Trading Cycles, its historical frequency to primary cycles was a whopping 86%! That’s one of the highest geocosmic signatures we discovered for stock indices. But it also has a strong correlation to rallies in the Gold market.
However, there is a different character to Neptune stationary than Saturn. Whereas Saturn demands accountability and proof before trusting, Neptune does not. Neptune is much more vulnerable, sensitive, and prone to be easily influenced by the crowd (i.e., media). This is a time when con artists, manipulators, and propagandists may prey upon the vulnerable, the naïve, for under Neptune’s presence, people tend to be more gullible. Therefore, this is a time when false rumors abound and fact-checkers will be busier than usual (+/- 10 days). The lesson is not to believe everything you hear or read unless it can be verified. People may try to convince you of their views and needs without the complete disclosure of all the facts that you need to make an informed decision. It’s possible the effort to convince others of their narratives involves intentional untruths as well.
In terms of financial markets, Saturn and Neptune turning retrograde close in time to one another has a strong correlation to major moves in stocks, Gold, and Crude Oil. In terms of politics, it heightens the possibility of errors, paranoia, confusion, bumbling, and being caught in a lie. For traders, this is a time to recognize whether a market move is the result of a rumor or fact. If it is a rumor, the move may be short-lived. In the trading community, the saying goes, “Buy the rumor, sell the fact.” It can apply to one’s personal life, too, especially in matters of the heart. It can arouse a feeling of infatuation and unbridled euphoria about…something or someone. But does it have legs it can really stand on? That’s what Saturn wants to know.
So, together, Saturn and Neptune can exhibit a scene of “popping a bubble.” Don’t fall in love with the bubble or it’s trouble. Fall in love with virtue. The former may have a thrilling beginning, but the latter has a happier ending, which is what Saturn and Neptune really wish for.
Author

Raymond Merriman, CTA
The Merriman Market Analyst
Raymond A. Merriman is the President of the Merriman Market Analyst, Inc and founder of the Merriman Market Timing Academy.


