Week ahead: Tariffs and US data eyed
Risk-off sentiment dominated flow last week following US President Donald Trump’s reciprocal tariff announcement, an event he described as ‘Liberation Day’. However, while I cannot speak for everyone, many are not feeling so liberated, with forecasts for growth and inflation upended, as well as economists forecasting a possible global recession.
The tariff announcement on 2 April was not digested well by markets, with an evident increase in volatility. Global equities went into freefall and ended the week red across the board, the VIX (Cboe Volatility Index) finished above 45.00 (levels not seen since August 2024), US Treasuries were heavily bid, and the US dollar (USD) closed down 1.4% (per the USD Index), shaking hands with levels not seen since late September 2024, and traditional safe-haven currencies benefitted. In the commodities space, Spot Gold (XAU/USD) explored lower levels from all-time highs of US$3,167, down 1.5%, and WTI Oil (West Texas Intermediate) fell nearly 10%.
Unquestionably, Trump’s ‘Liberation Day’ captivated a global audience. All nations were slapped with a 10% baseline tax on imported goods into the US, which took effect on 5 April. On top of this, higher-than-expected levies were imposed on approximately 60 other countries and are anticipated to go into effect on 9 April, according to a White House Fact Sheet.
The US Employment Situation Report for March was also released on Friday just before the cash open. Despite federal layoffs, 228,000 new jobs were added to the economy, comfortably surpassing the market’s median estimate of 135,000 and 151,000 in February. Despite demonstrating US economic resilience and further highlighting the divergence between hard and soft data, markets were somewhat muted following its release, overshadowed by the global market turmoil from Trump’s tariffs. However, Trump welcomed the latest jobs numbers. He commented via his Truth Social Platform: ‘GREAT JOB NUMBERS, FAR BETTER THAN EXPECTED. IT’S ALREADY WORKING. HANG TOUGH, WE CAN’T LOSE!!!’.
US unemployment ticked slightly higher to 4.2% from 4.1%, with wage growth remaining unchanged at 0.3% month-on-month (MM) and easing to 3.8% from 4.0% year-on-year (YY).
Tariffs; inflation; Fed Minutes; consumer sentiment
In addition to markets closely monitoring US tariff developments this week, particularly responses from trading partners, the macro spotlight will be on US inflation numbers, minutes from the last Fed meeting and consumer sentiment data.
March’s US CPI Inflation data (Consumer Price Index) will be a key risk event to watch on Thursday this week, particularly with risks of higher inflation amid tariffs and the possibility of further policy easing this year.
Signs of elevated price pressures could see investors pare back rate cut bets, which may weigh on US Treasury yields and the USD, while lower-than-expected inflation could prompt the opposite outcome and underpin yields and the USD. Economists estimate YY CPI inflation eased in March, cooling to 2.6% (from 2.8% in February) at the headline level and 3.0% (from 3.1%) based on the core measure. Headline MM CPI inflation is also expected to slow to 0.1% (from 0.2%), while core CPI inflation is anticipated to have ticked higher to 0.3% (from 0.2%).
The Fed meeting minutes on Wednesday will also be watched closely this week and may provide more indication into inflation expectations and whether forecasts of four rate cuts this year are realistic. You will recall that the Fed kept the target rate on hold in March at 4.25% – 4.50% and highlighted an ‘increase’ in economic uncertainty and a reduction in the pace of Quantitative Tightening (QT). Through the Fed’s Summary of Economic Projections, members noted that they still expect two rate cuts this year, though it is important to note that more members lent towards leaving the Fed funds rate on hold this year. Real GDP (Gross Domestic Product) forecasts were also revised lower this year, as well as in 2026 and 2027, with PCE inflation (Personal Consumption Expenditures) revised upward for 2025 and 2026 and is expected to reach the Fed’s inflation target of 2.0% by 2027.
Friday’s consumer sentiment survey data for April from the University of Michigan will be an interesting print to monitor, given sentiment is already in the doldrums. However, although the sample set for this release is small – 500 telephone interviews compared to 3,000 in the US Conference Board survey – the interview dates for this week’s preliminary release are between 25 March and 7 April, meaning the tail end of this date range includes Trump’s tariffs. As such, it could help provide some insight into how much tariffs have impacted sentiment. Unsurprisingly, the current median forecast suggests a drop to 54.9 (from March’s 57.0), with an estimate range between 56.5 and 52.7.
Technicals on the radar this week
US Dollar Index:
Those who follow my technical reports regularly may recall that I have been watching the USD for some time now. To save me repeating myself, in last week’s preview, I noted the following (italics):
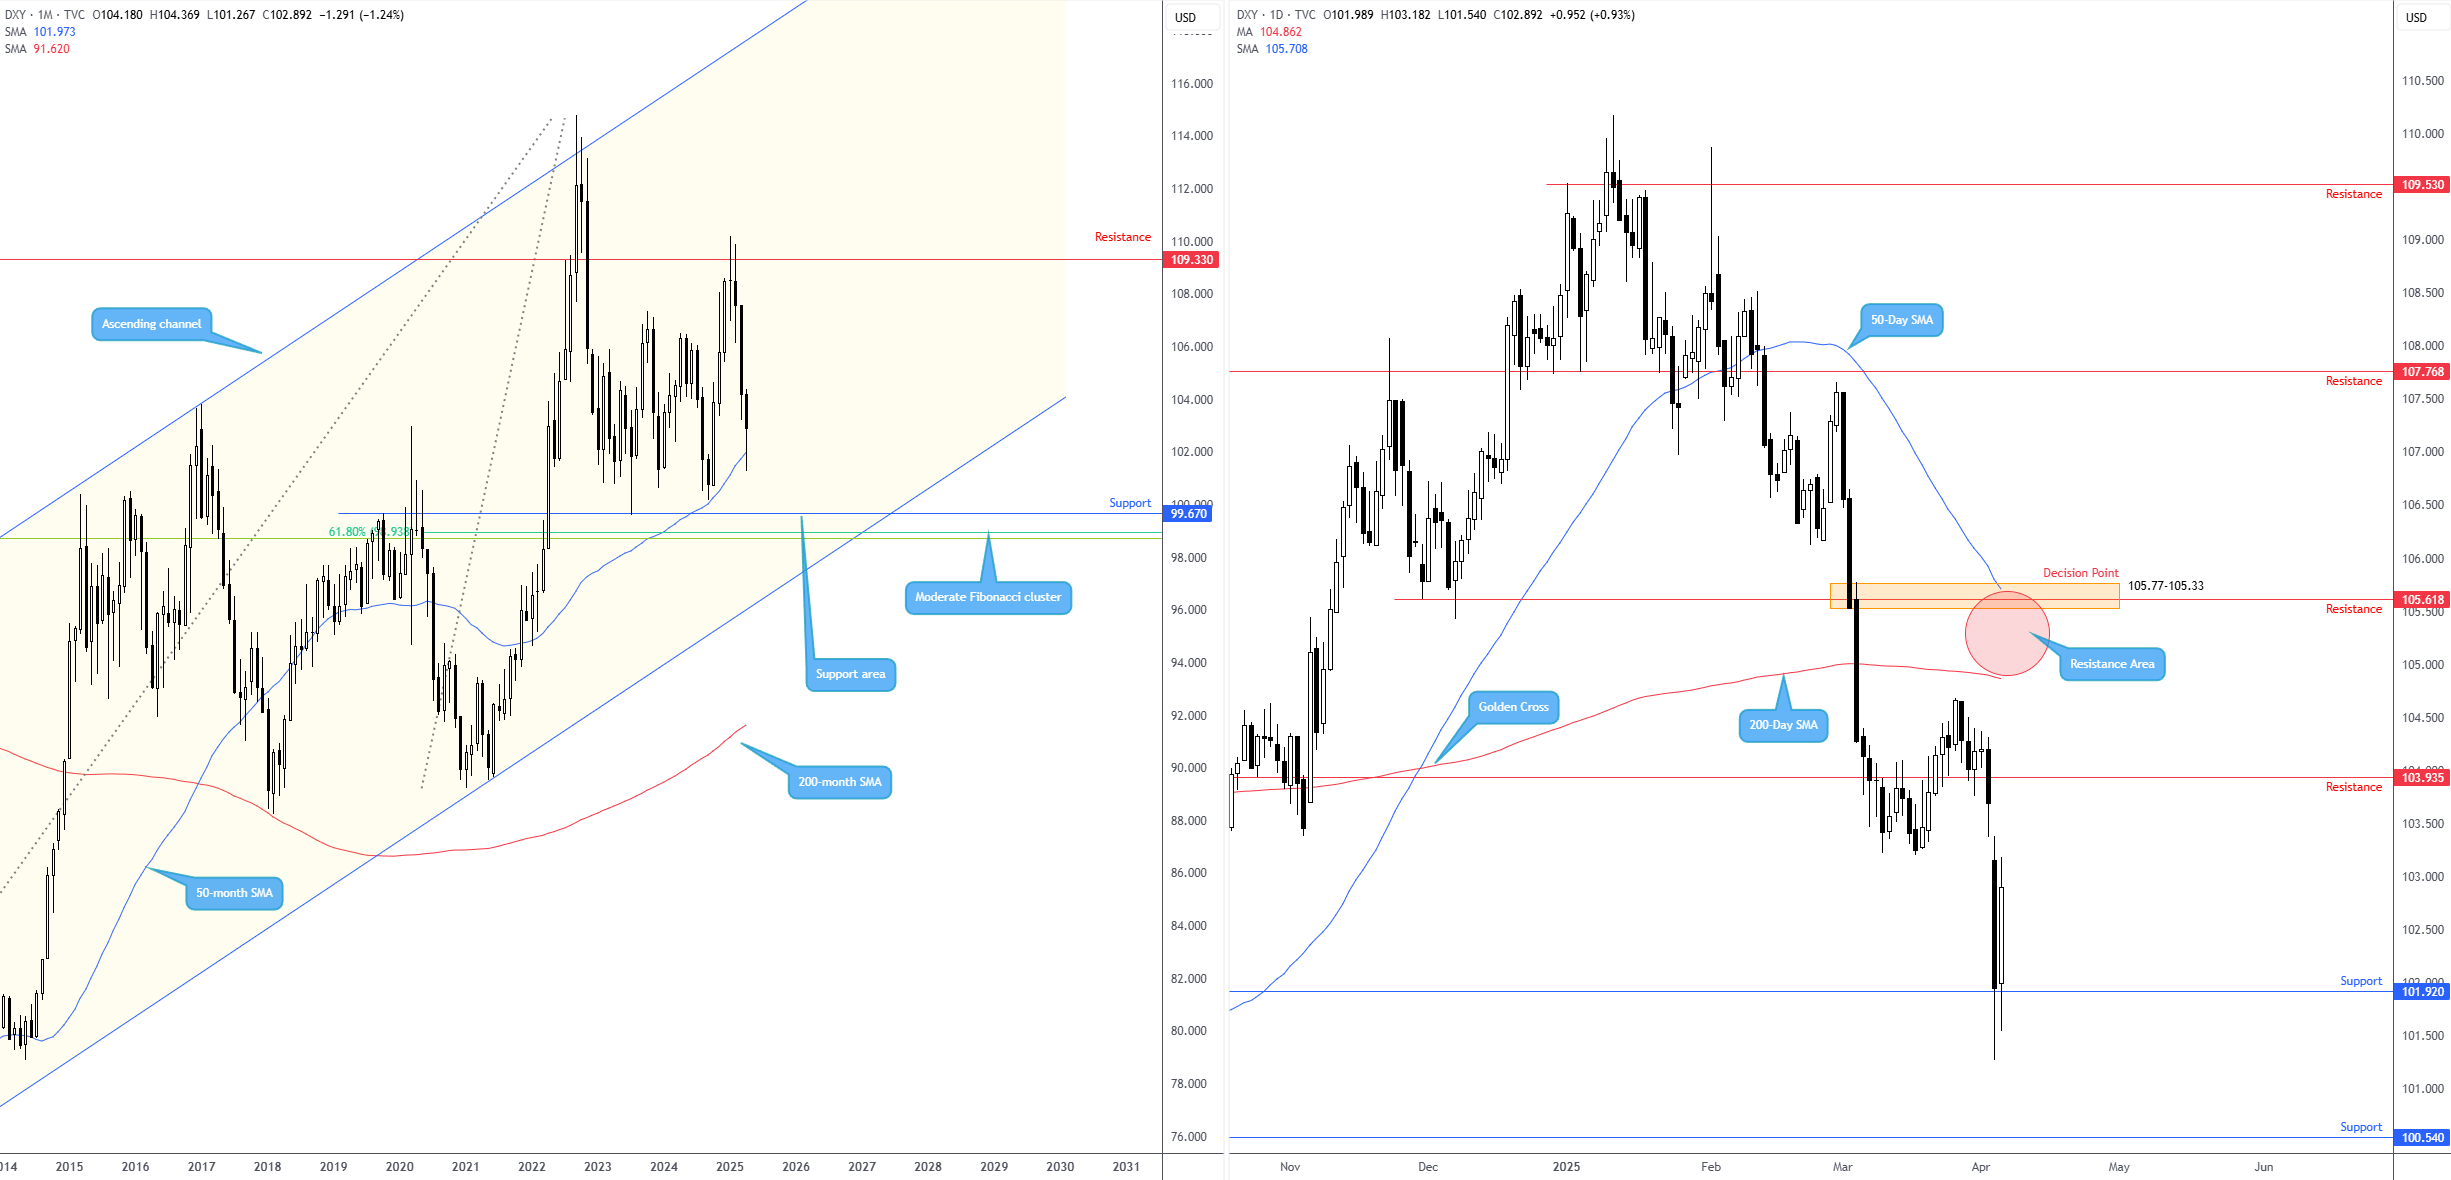
Regarding the USD’s technical position, the USD Index continues to exhibit scope to explore lower levels on the monthly chart until the 50-month simple moving average (SMA) at 101.73. This follows a rejection of resistance at 109.33 at the start of this year. Meanwhile, price action on the daily timeframe ended last week testing resistance-turned-support at 103.94. Given what I see on the monthly scale, USD bulls are unlikely to print anything meaningful from 103.94, especially with the 200-day SMA circling above at 104.92. As a result, I expect sellers to eventually change gear and breach 103.94, opening the door for a bearish scenario towards support at 101.92 – located just north of the noted 50-month SMA.
As you can see, price touched gloves with daily support at 101.92 and the 50-month SMA at 101.97 and pencilled in a reasonable recovery at the tail end of the week. Looking ahead, aside from the possibility of traders playing the range between resistance at 103.94 and support coming in at 101.92 on the daily chart, areas outside of this base that I believe deserve a place on the watchlist are resistance between 105.77 and 104.86 (this consists of a decision point zone, a horizontal resistance, as well as the 50- and 200-day SMAs), and a support level from 100.54.
WTI Oil and Gold:
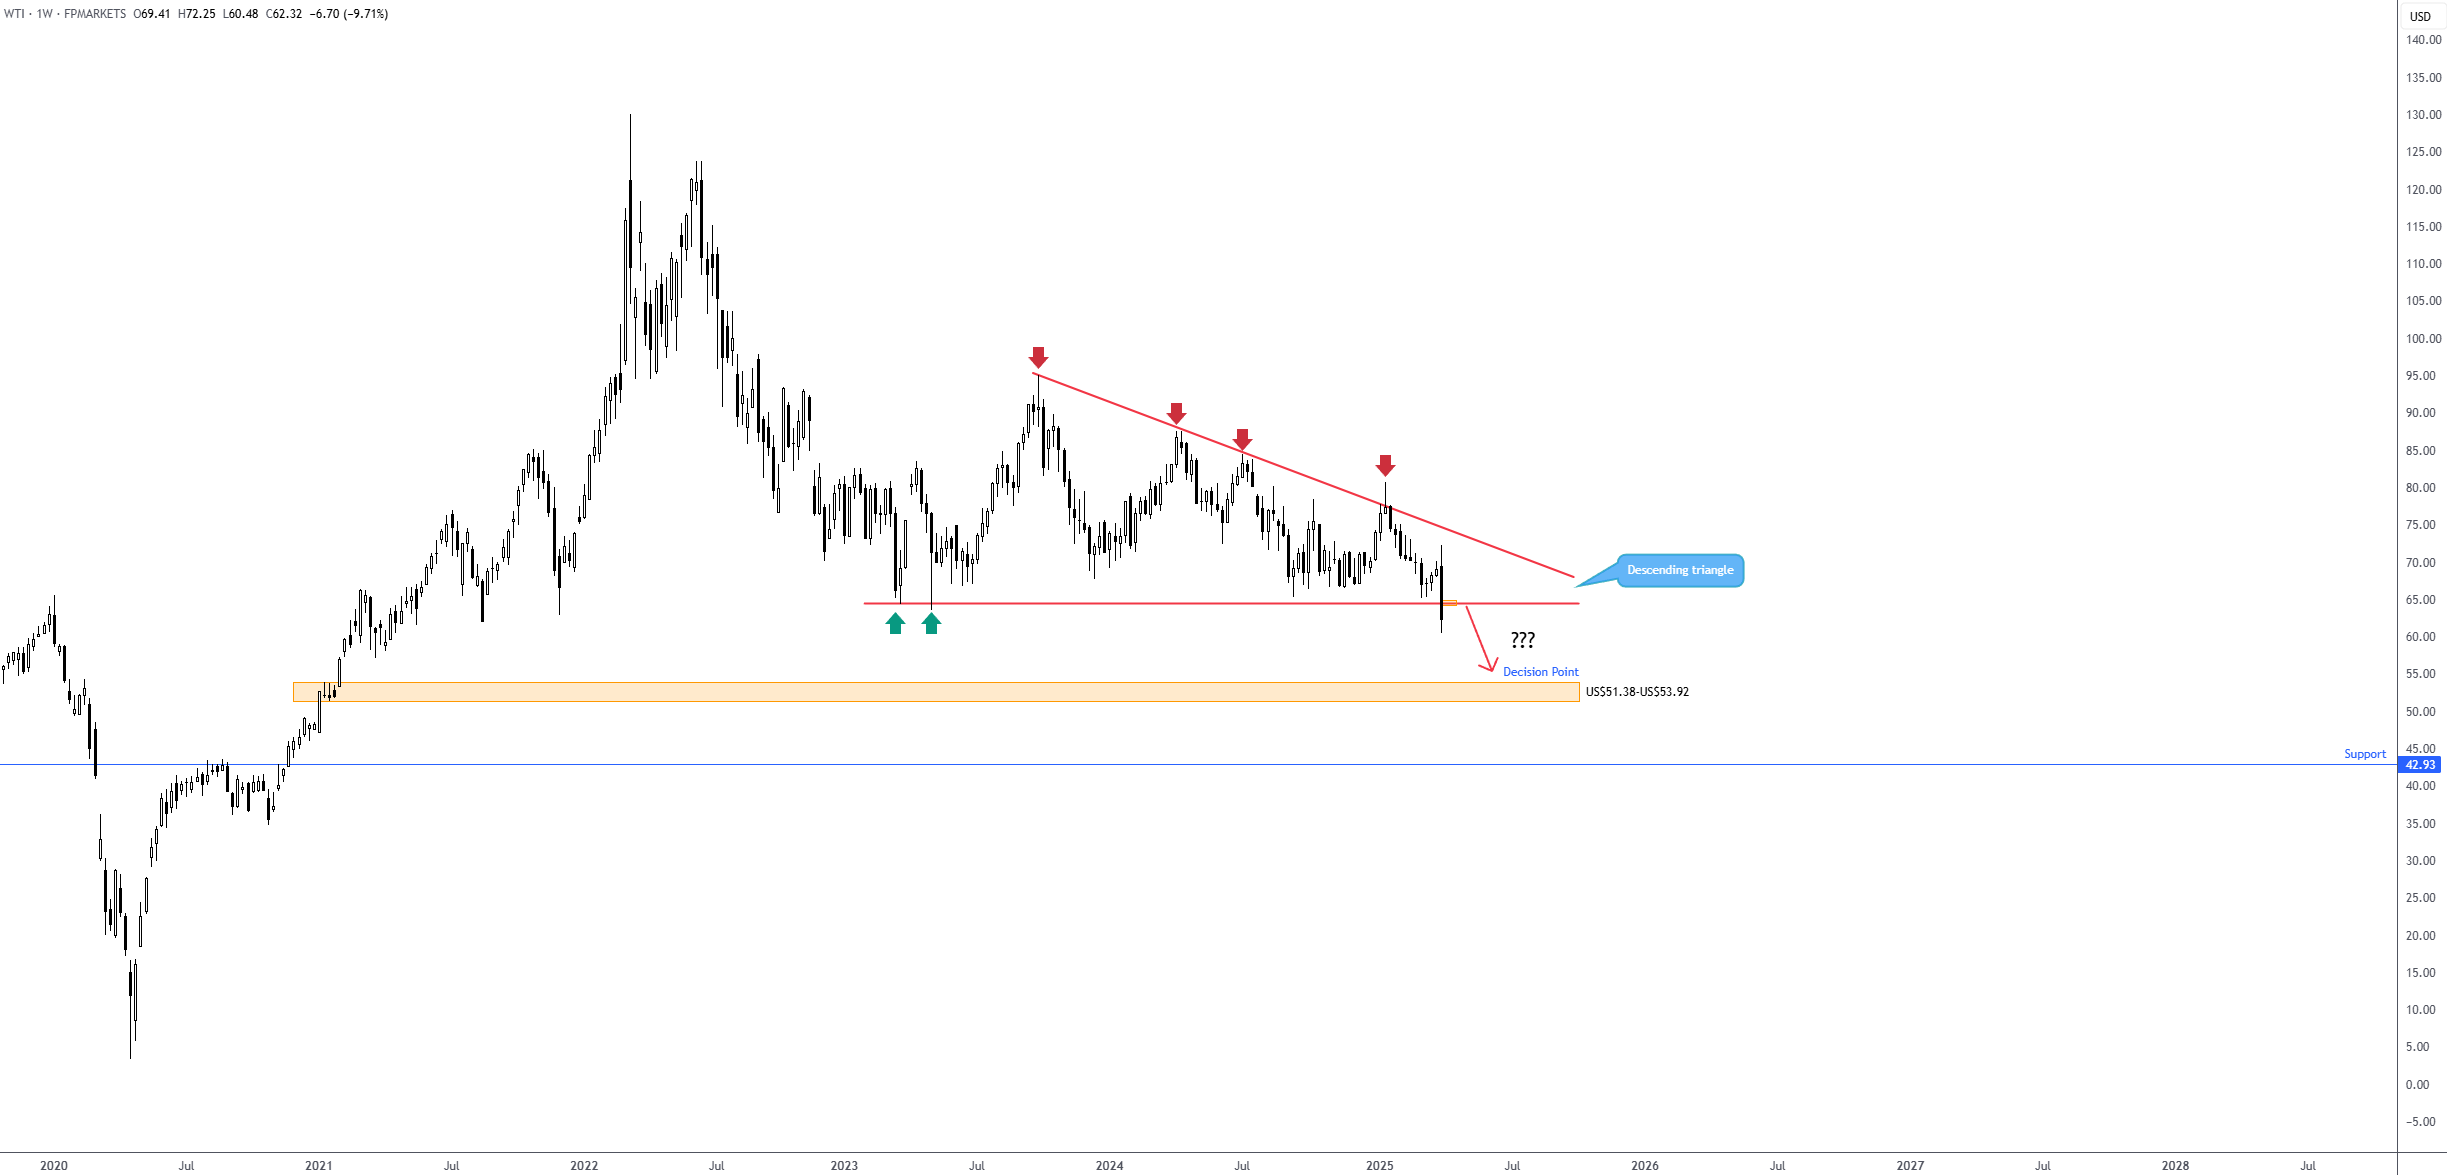
As mentioned, WTI shed nearly 10% last week and tested levels not seen since early 2021. As a result, the downside move punctured the lower boundary of a descending triangle formation on the weekly chart, extended from a high of US$95.01 and a low of US$64.34. Technically, this opens the door to possible bearish scenarios in the weeks to come toward a decision point zone at US$51.38-US$53.92. With that in mind, if you drill down to the H1 timeframe, you will note a bearish decision point zone formed at the lower boundary of the weekly chart’s descending triangle at US$64.90-US$64.24. This could be a location that traders look to fade from in the event of a pullback-retest play unfolding this week.
Spot Gold also suffered last week, registering its first losing week since early March. While the yellow metal’s move lower may surprise some, given that it tends to rise amid economic uncertainty, I believe the selloff was triggered by investors liquidating their positions to cover losses elsewhere.
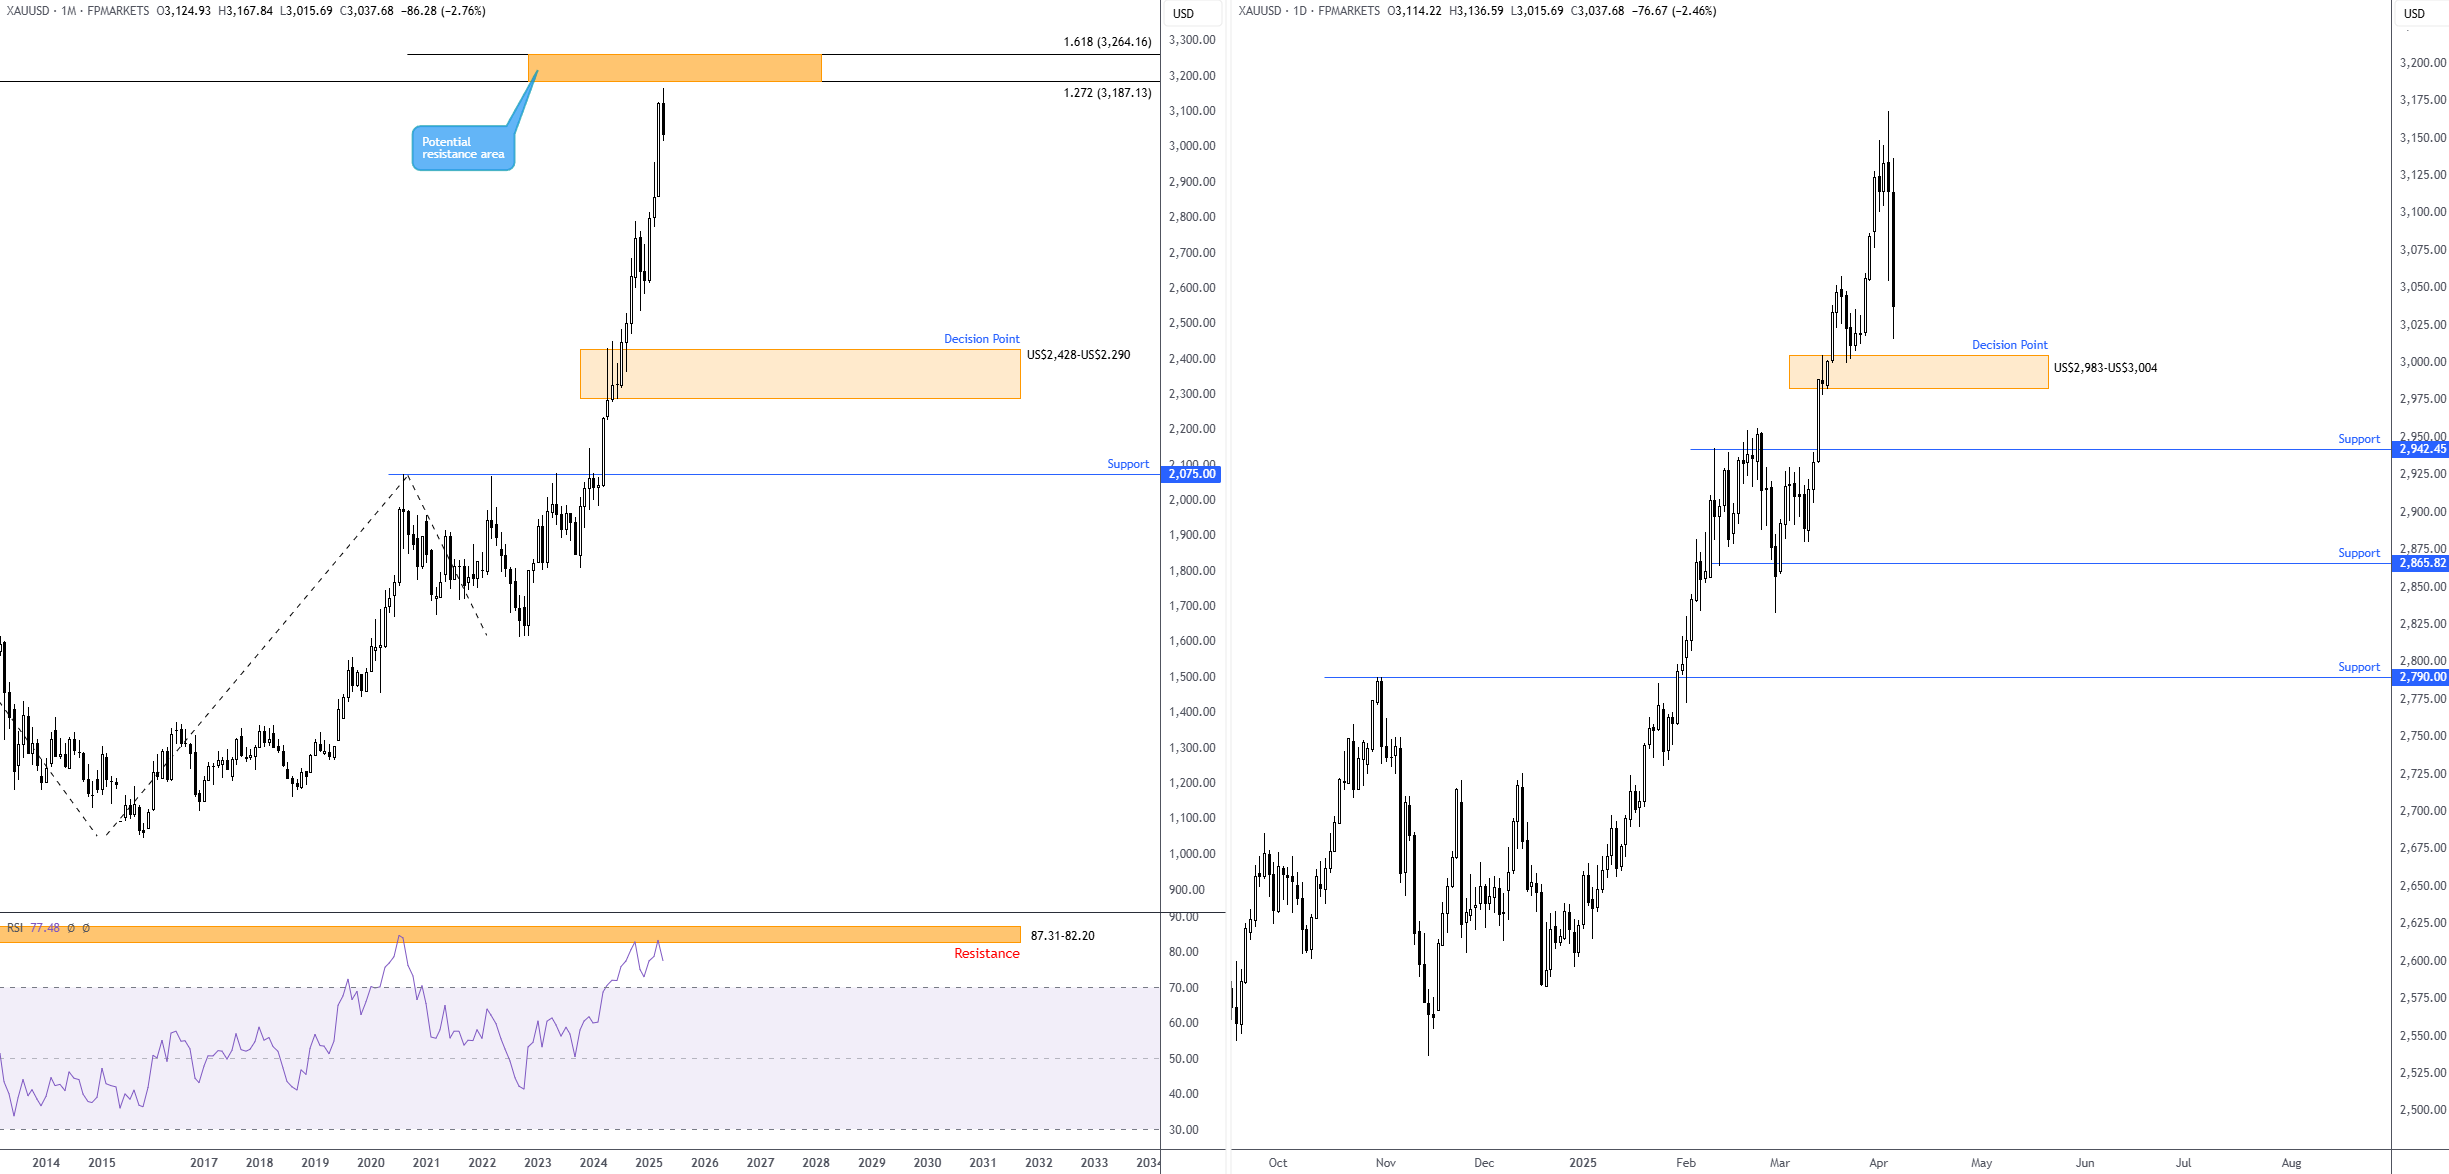
As seen from the monthly chart of Gold, price action printed an all-time high of US$3,167 in recent trading, just shy of noted resistance between US$3,264 and US$3,187 (1.618% and 1.272% Fibonacci projection ratios, respectively).
A daily decision point zone at US$2,983-US$3,004 (a noted area to watch in a number of previous reports) is unlikely to offer much of a floor due to it already welcoming buyers in late March. However, since this area has technically built some trust, buyers could attempt to make a show from the zone and position stop-loss orders just beneath it. That said, I am still more drawn to the support level south of the area at US$2,942 as a possible base from which buyers could appear to take advantage of liquidity from below the said decision point zone (sell stops).
S&P 500:
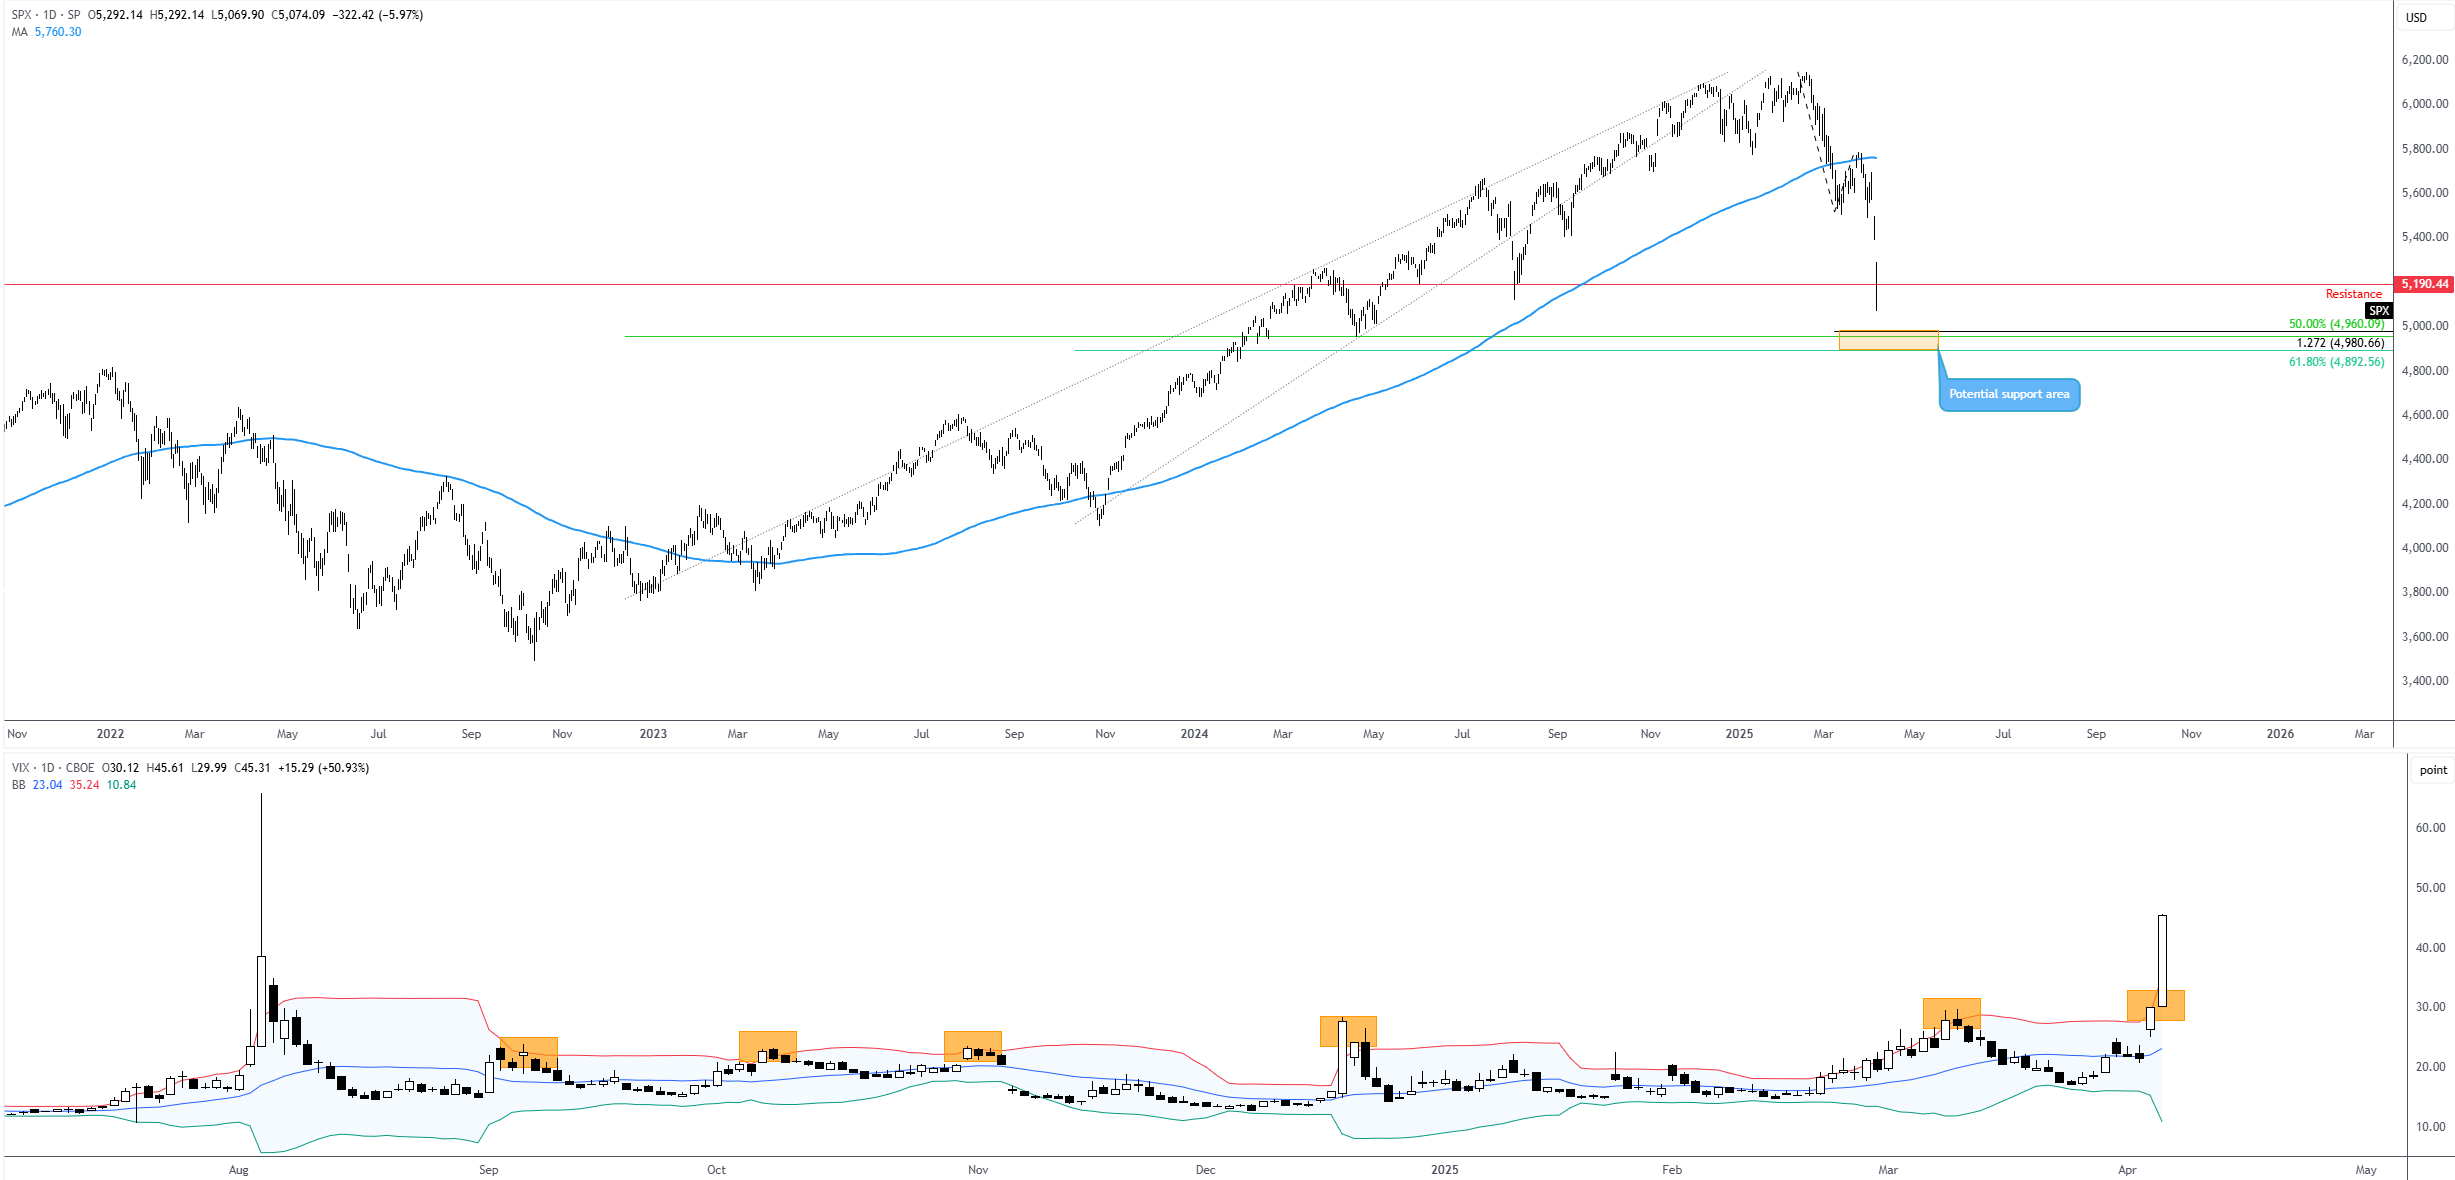
Unsurprisingly, the VIX Index – one of the most popular measures of US stock market volatility – recently shook hands with 45.00, levels not seen since August 2024. As a result, I am closely monitoring the daily charts of the VIX (with standard Bollinger Bands overlaid) and the S&P 500.
As shown on the charts, the VIX closed above the upper Bollinger Band, signalling that sentiment could be overstretched and may revert to the mean. Consequently, as on many occasions, this suggests that S&P 500 bulls may soon attempt to step in from a technical standpoint. However, chart studies reveal support is not evident until between 4,892 and 4,960. Interestingly, this indicates that further underperformance and higher VIX levels could be on the table before we see signs of a reversal.
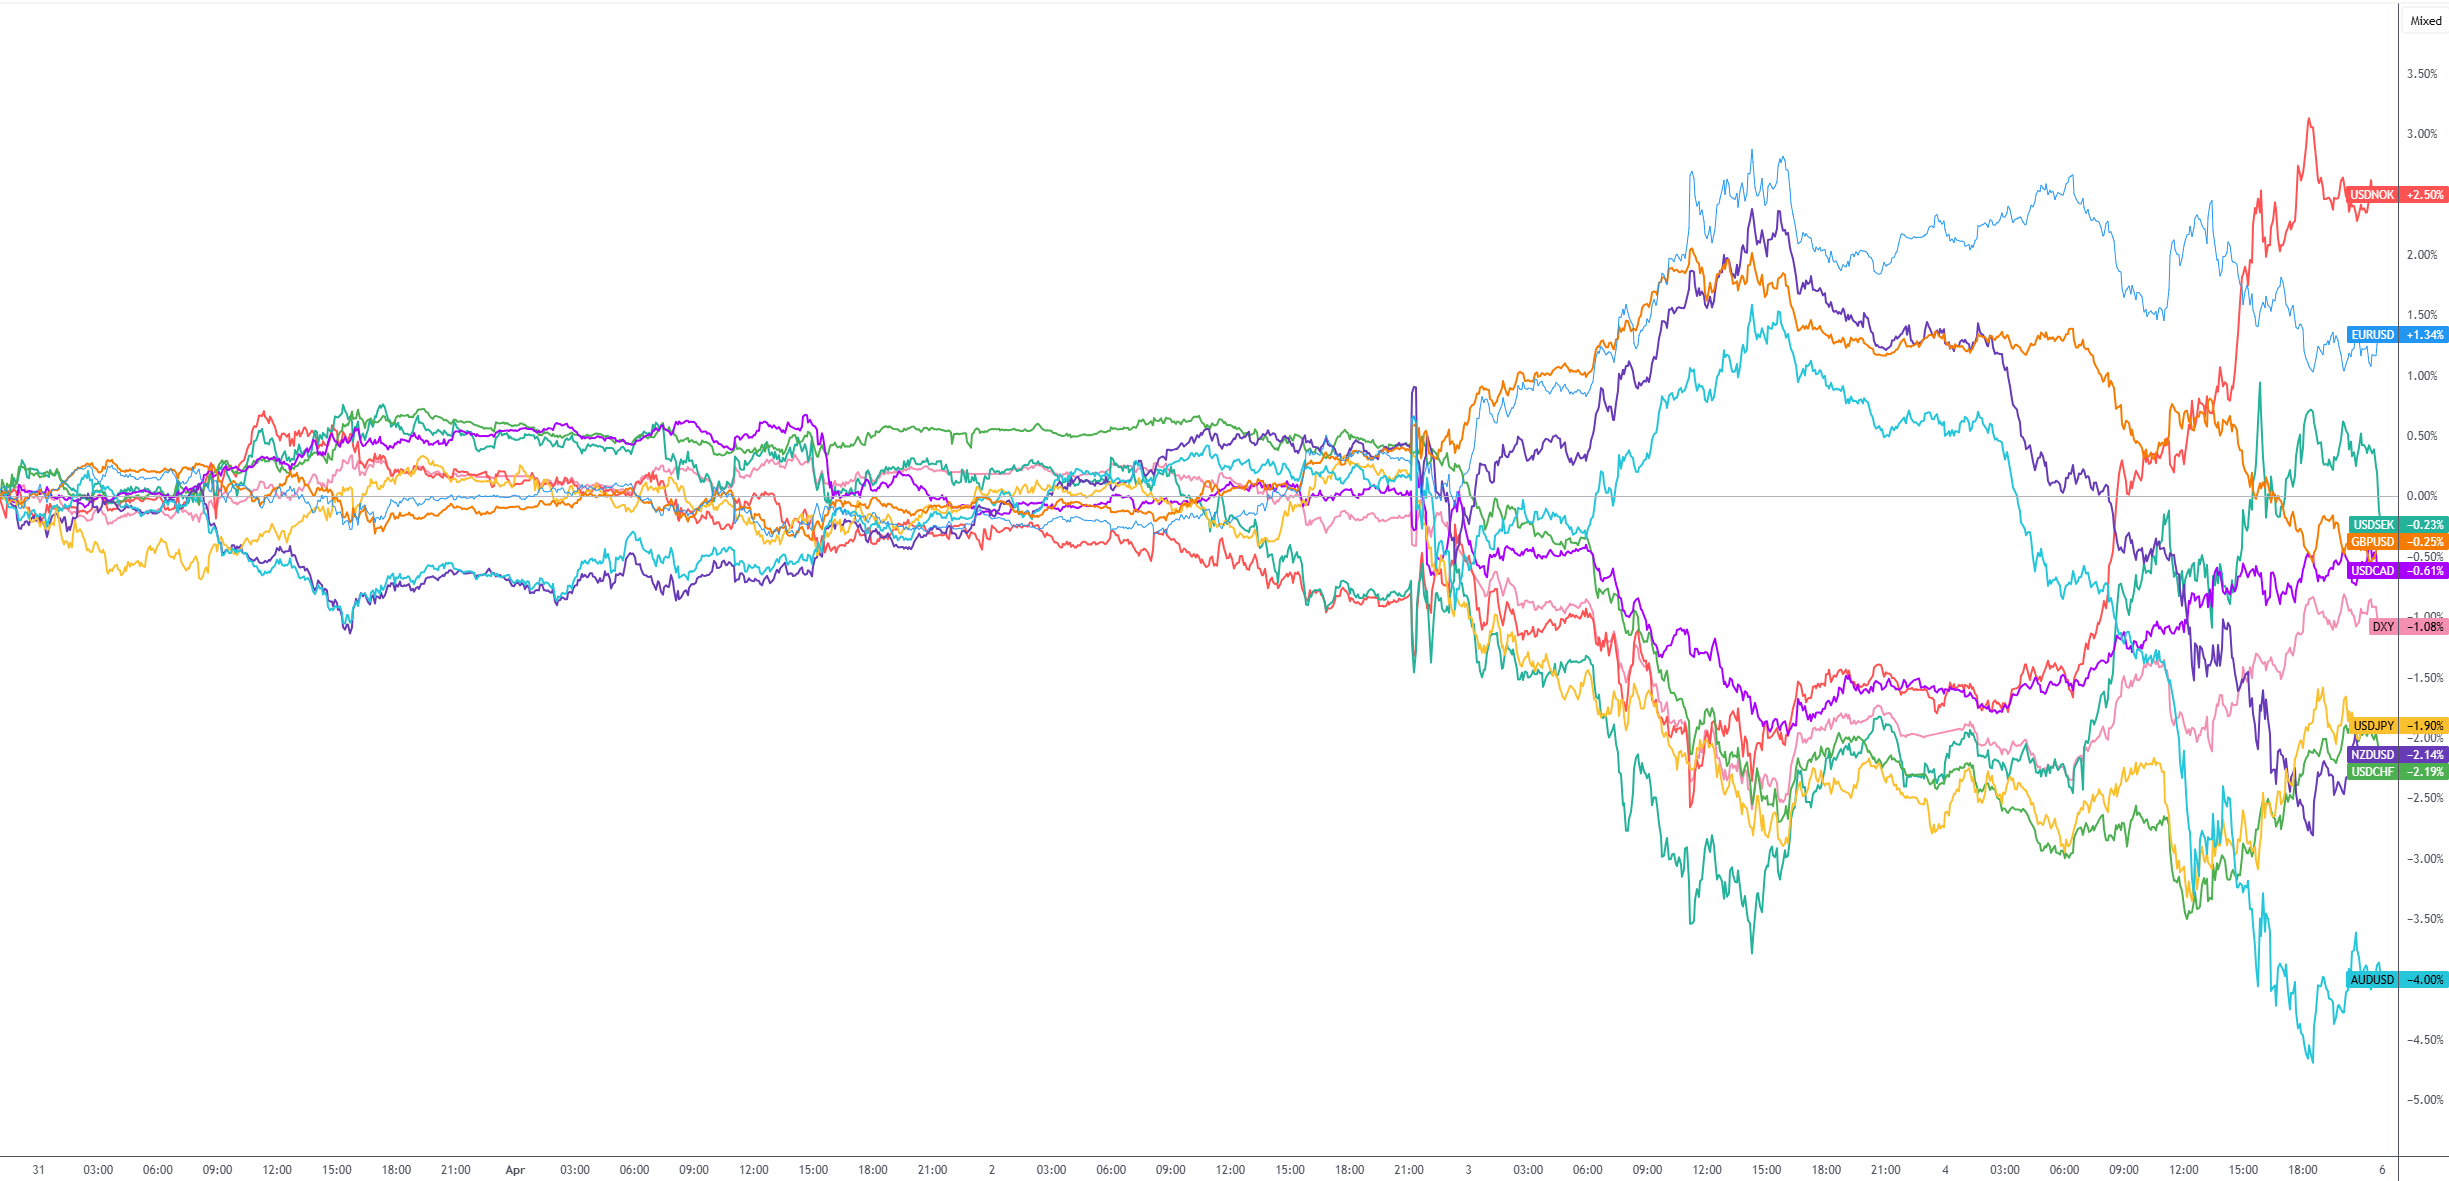
Weekly G10 FX performance:
Author

Aaron Hill
FP Markets
After completing his Bachelor’s degree in English and Creative Writing in the UK, and subsequently spending a handful of years teaching English as a foreign language teacher around Asia, Aaron was introduced to financial trading,


