Week ahead from a technical perspective

USD bulls on the ropes
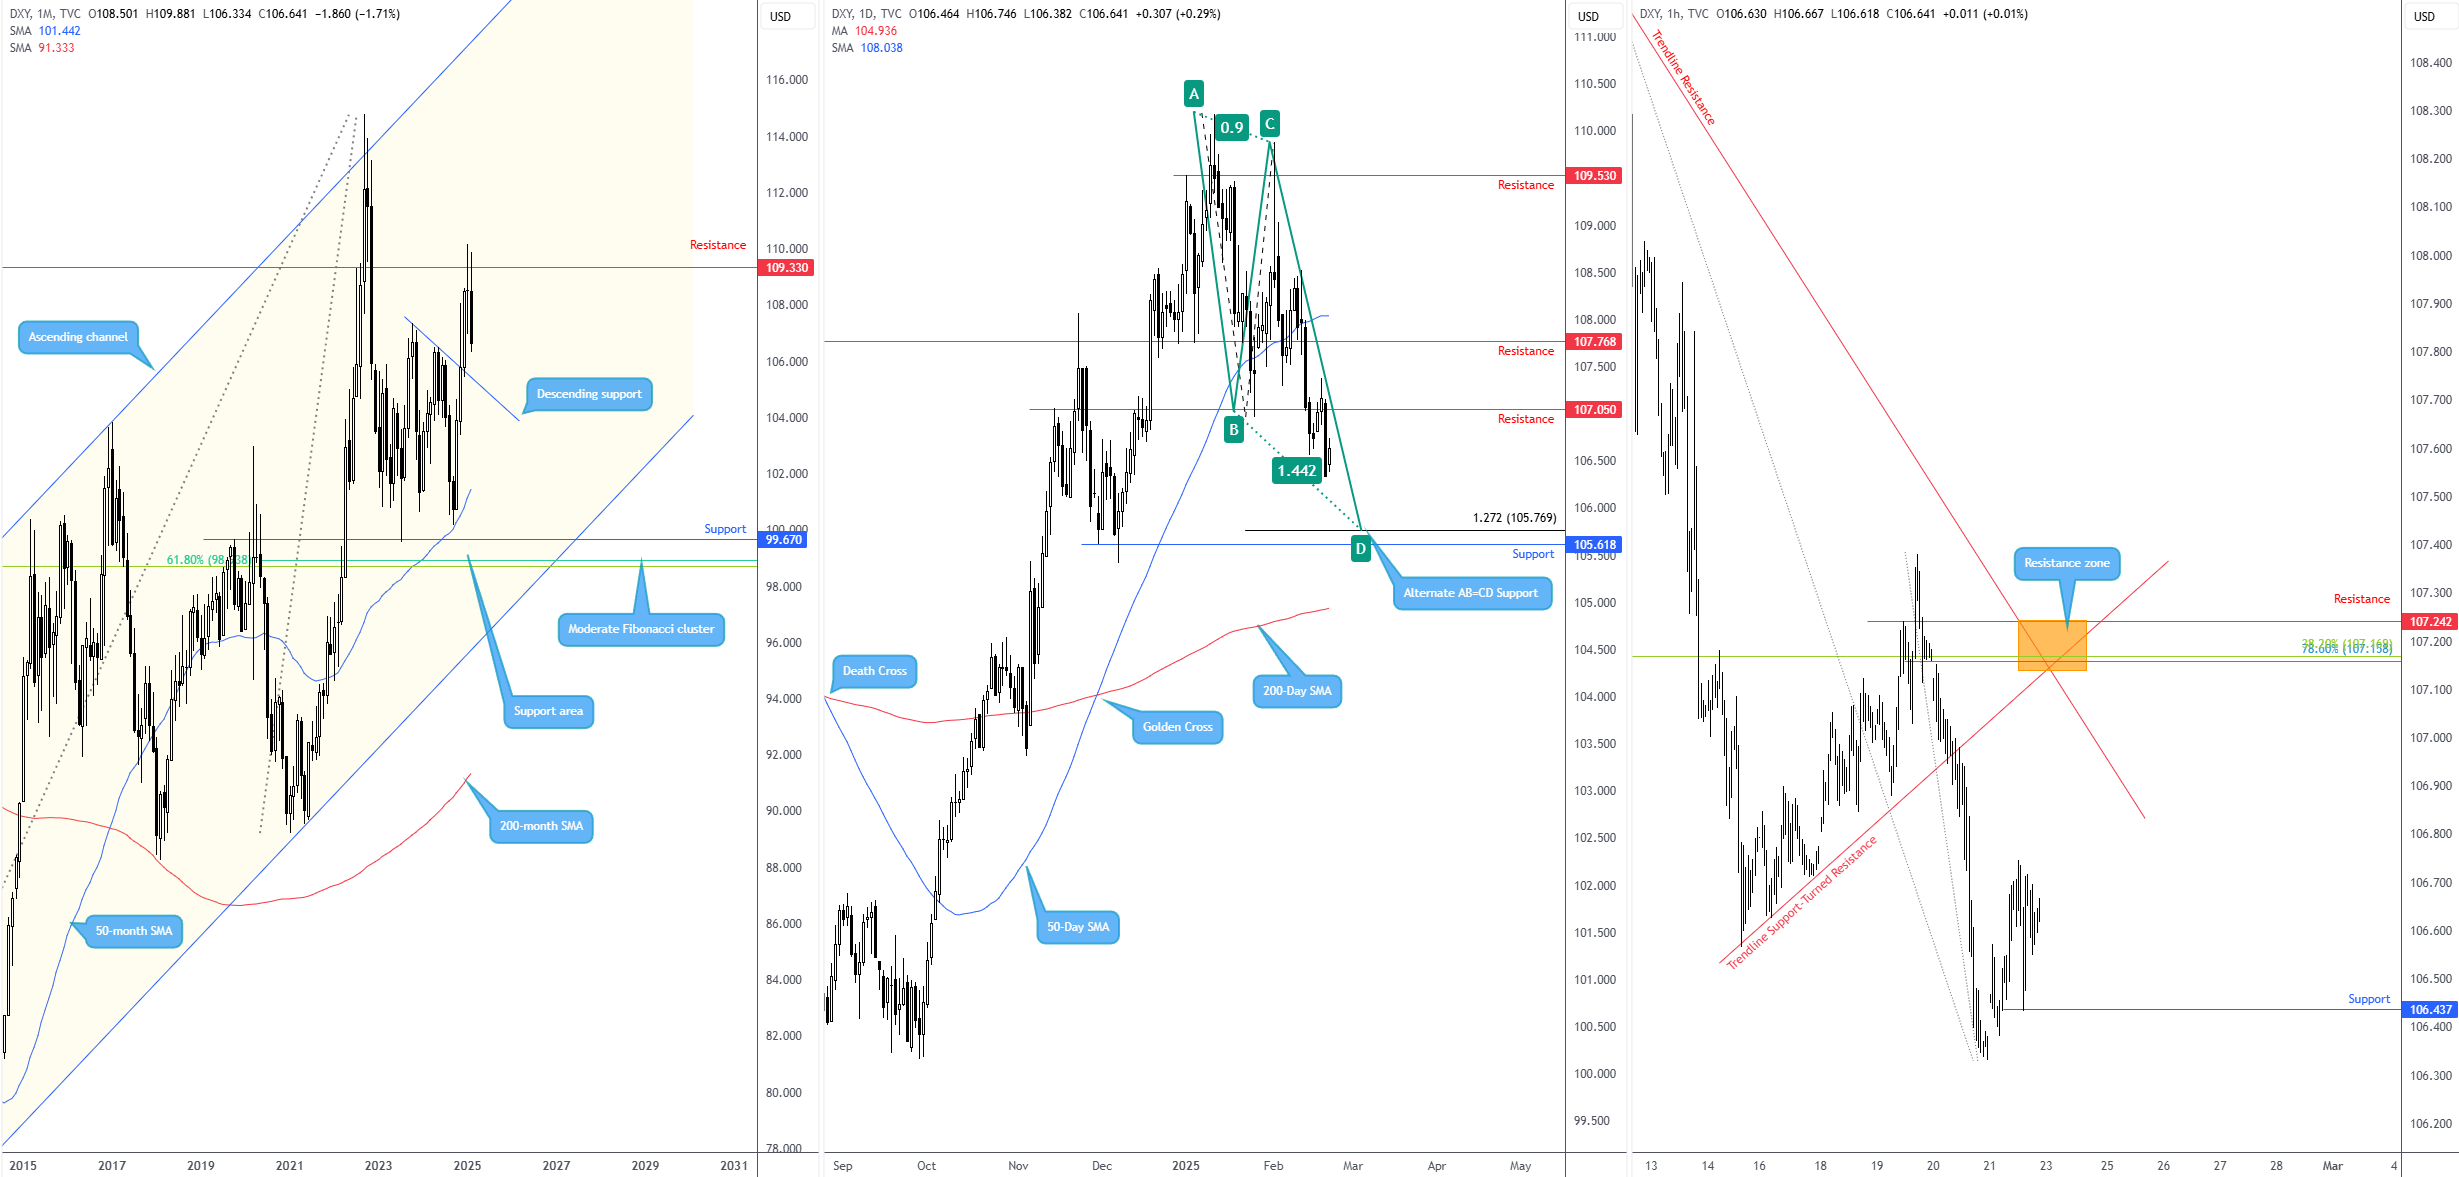
The US dollar (USD) – per the US Dollar Index – is on track to end February on the ropes following January’s monthly indecision candle at the resistance of 109.33. I believe USD bears have space to drive towards a ‘local’ descending support around 105.40ish, extended from the high of 107.35.
Similarly, the daily timeframe demonstrates scope for sellers to strengthen their grip. Last week witnessed the Index reject resistance at 107.05, drawing focus towards an ‘alternate’ AB=CD from 105.77 (the 1.272% Fibonacci projection ratio). For those unfamiliar with Harmonic trading, an alternate AB=CD is simply an extended equal AB=CD formation using either 1.272% or 1.618% Fibonacci projection ratios. Interestingly, not only does the alternate AB=CD pattern share chart space with daily support at 105.62, but these daily levels are located just north of the monthly timeframe’s descending support line underlined above. Consequently, although there is room for bears to take control in the short to medium term, the combination of the monthly and daily support levels could entice profit-taking and encourage fresh long positions into the market, should we reach said area.
Given monthly and daily charts echoing a bearish vibe, I will primarily focus on short-term resistance levels this week. One standout area of H1 resistance is between 107.24 and 107.14, made up of two trendline resistance lines (drawn from 109.88 and 106.57), a horizontal resistance level and two Fibonacci retracement ratios (78.6% and 38.2%). What is also interesting from a technical perspective is that the above-noted H1 resistance zone converges closely with daily resistance mentioned above at 107.05, therefore should the H1 resistance area be tested, the fact daily resistance is also present could add weight to a bearish showing. Should we fail to reach as high as the H1 zone, my next base case scenario is to watch local H1 supports to cede ground to trigger possible selling opportunities: the 106.43 low, for example.
XAU/USD: The only way is up
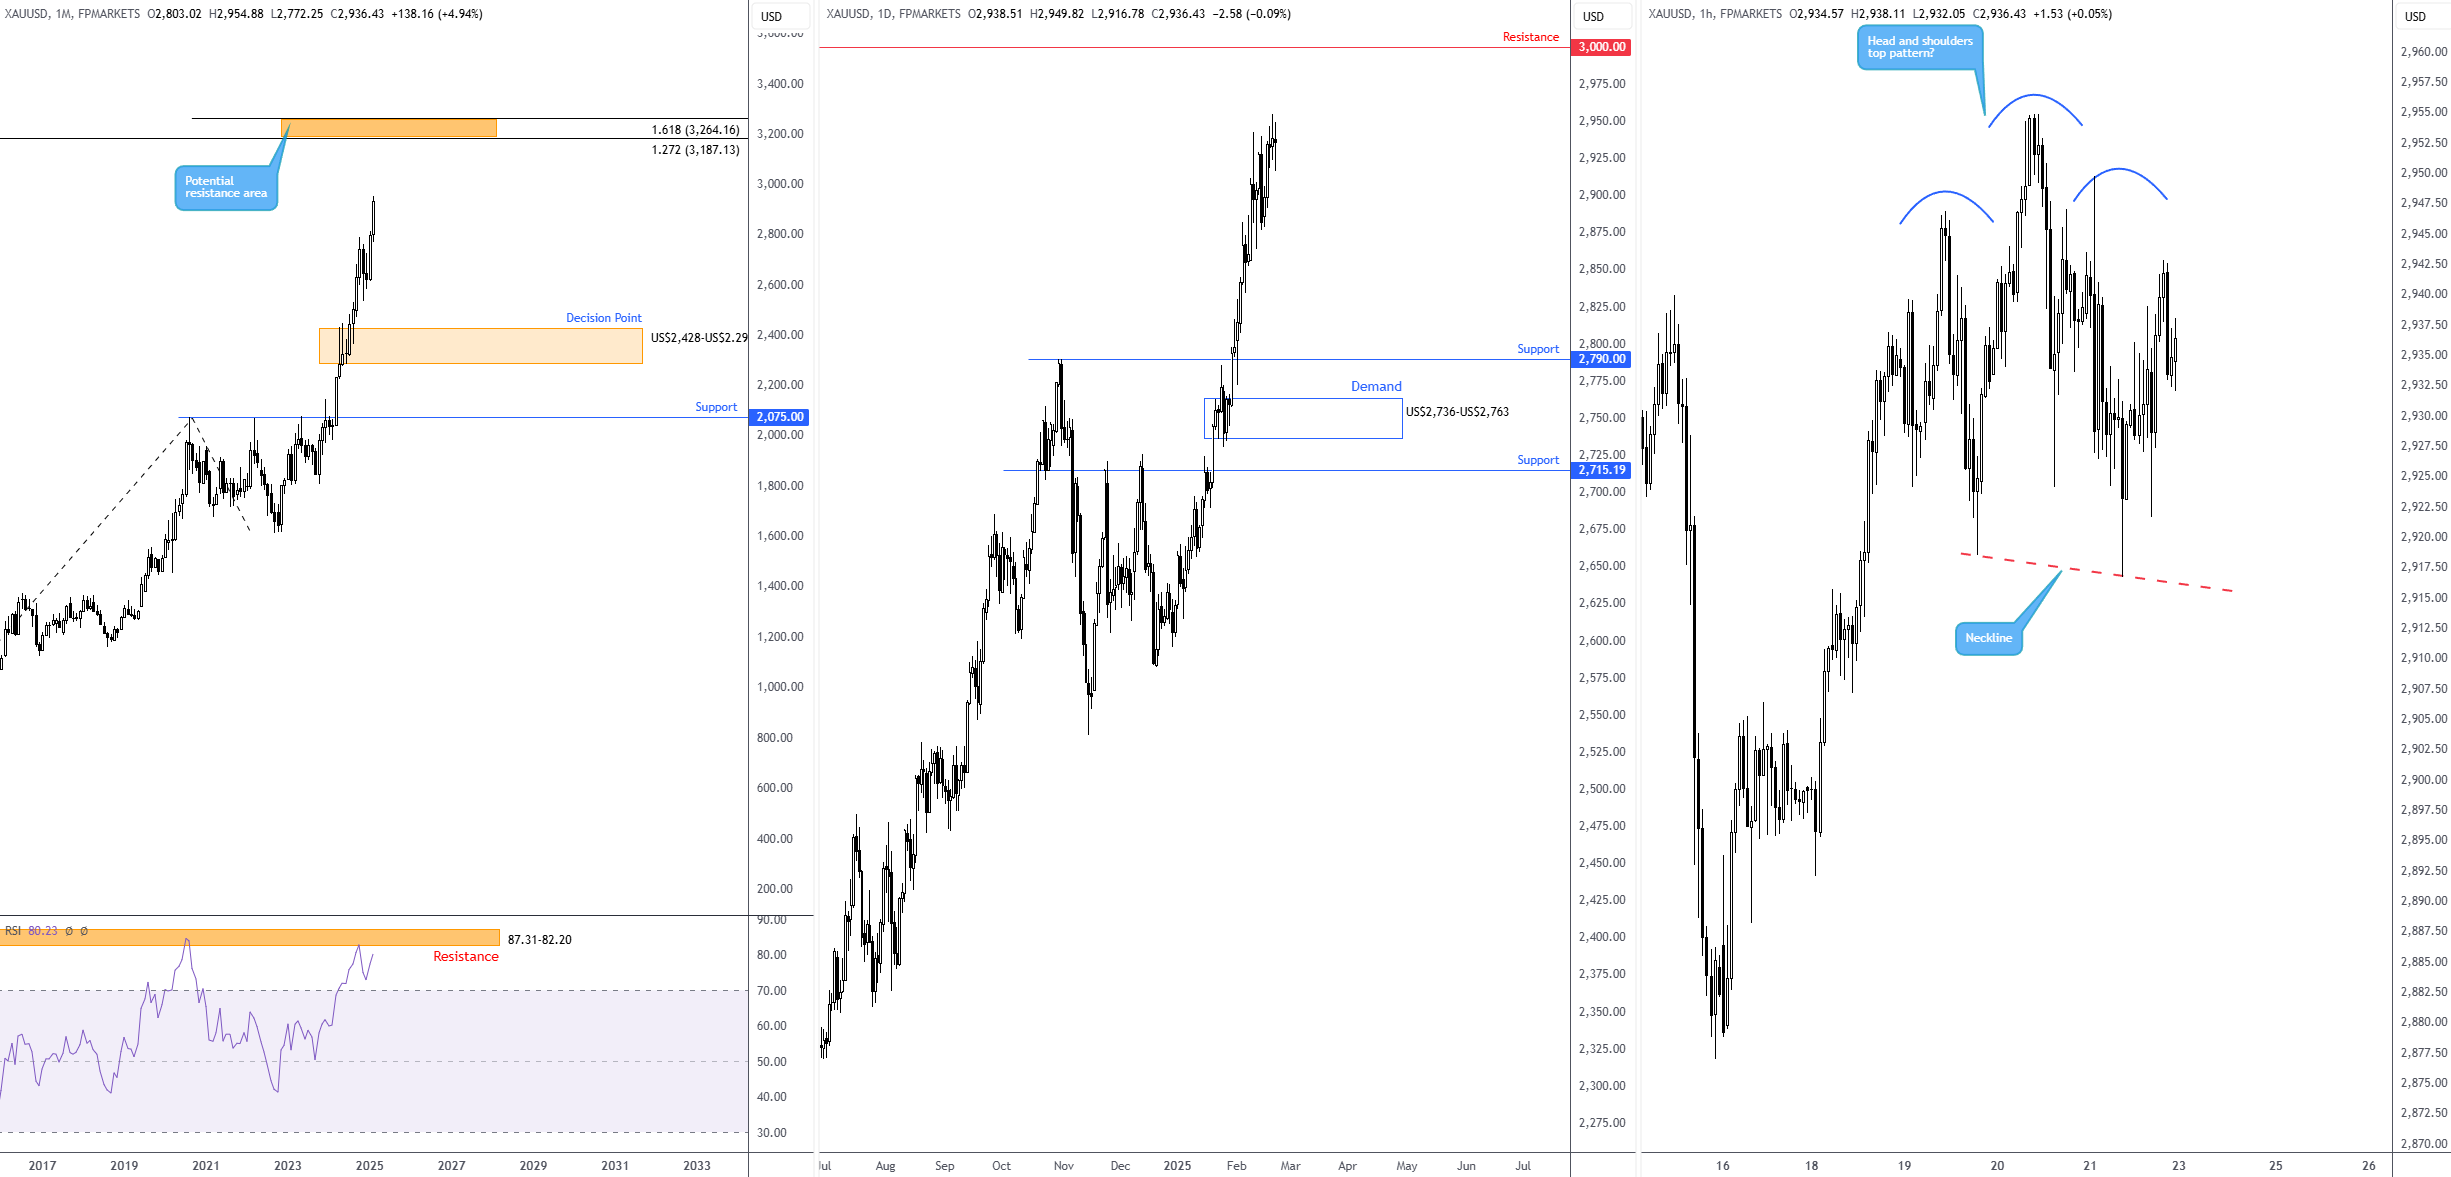
If it appears as if the price of spot gold (XAU/USD) chalks up an all-time high every week, it is. In fact, the precious metal rallied northbound for eight consecutive weeks, and opposing bearish themes are few and far between. Geopolitical risks, uncertainty surrounding US President Donald Trump’s tariff plans, and limited resistance until around US$3,000 (as shown on the daily chart) seat gold in a robust position. Another observation supporting gold’s position I feel worth highlighting is found on the monthly chart. Despite the Relative Strength Index testing resistance of 87.31-82.20, the next upside objective lies between US$3,264 and US$3,187, formed between 1.618% and 1.272% Fibonacci projection ratios, respectively. Goldman Sachs also recently updated their gold projection to US$3,100.
While monthly and daily flows suggest additional outperformance, the potential head and shoulders top pattern on the H1 timeframe indicates a move to the downside could be in store before further buying is seen. As you can see, the pattern’s neckline – taken from the low of US$2,918 – has yet to be engulfed, therefore there is still a chance the pattern will not complete and price continues to push higher from current levels. However, in the event the yellow metal does engulf the neckline, it is common for chart pattern enthusiasts to apply a downside profit objective by extending the value between the head and the neckline from the breakout point.
SOL/USD: Bears resume control
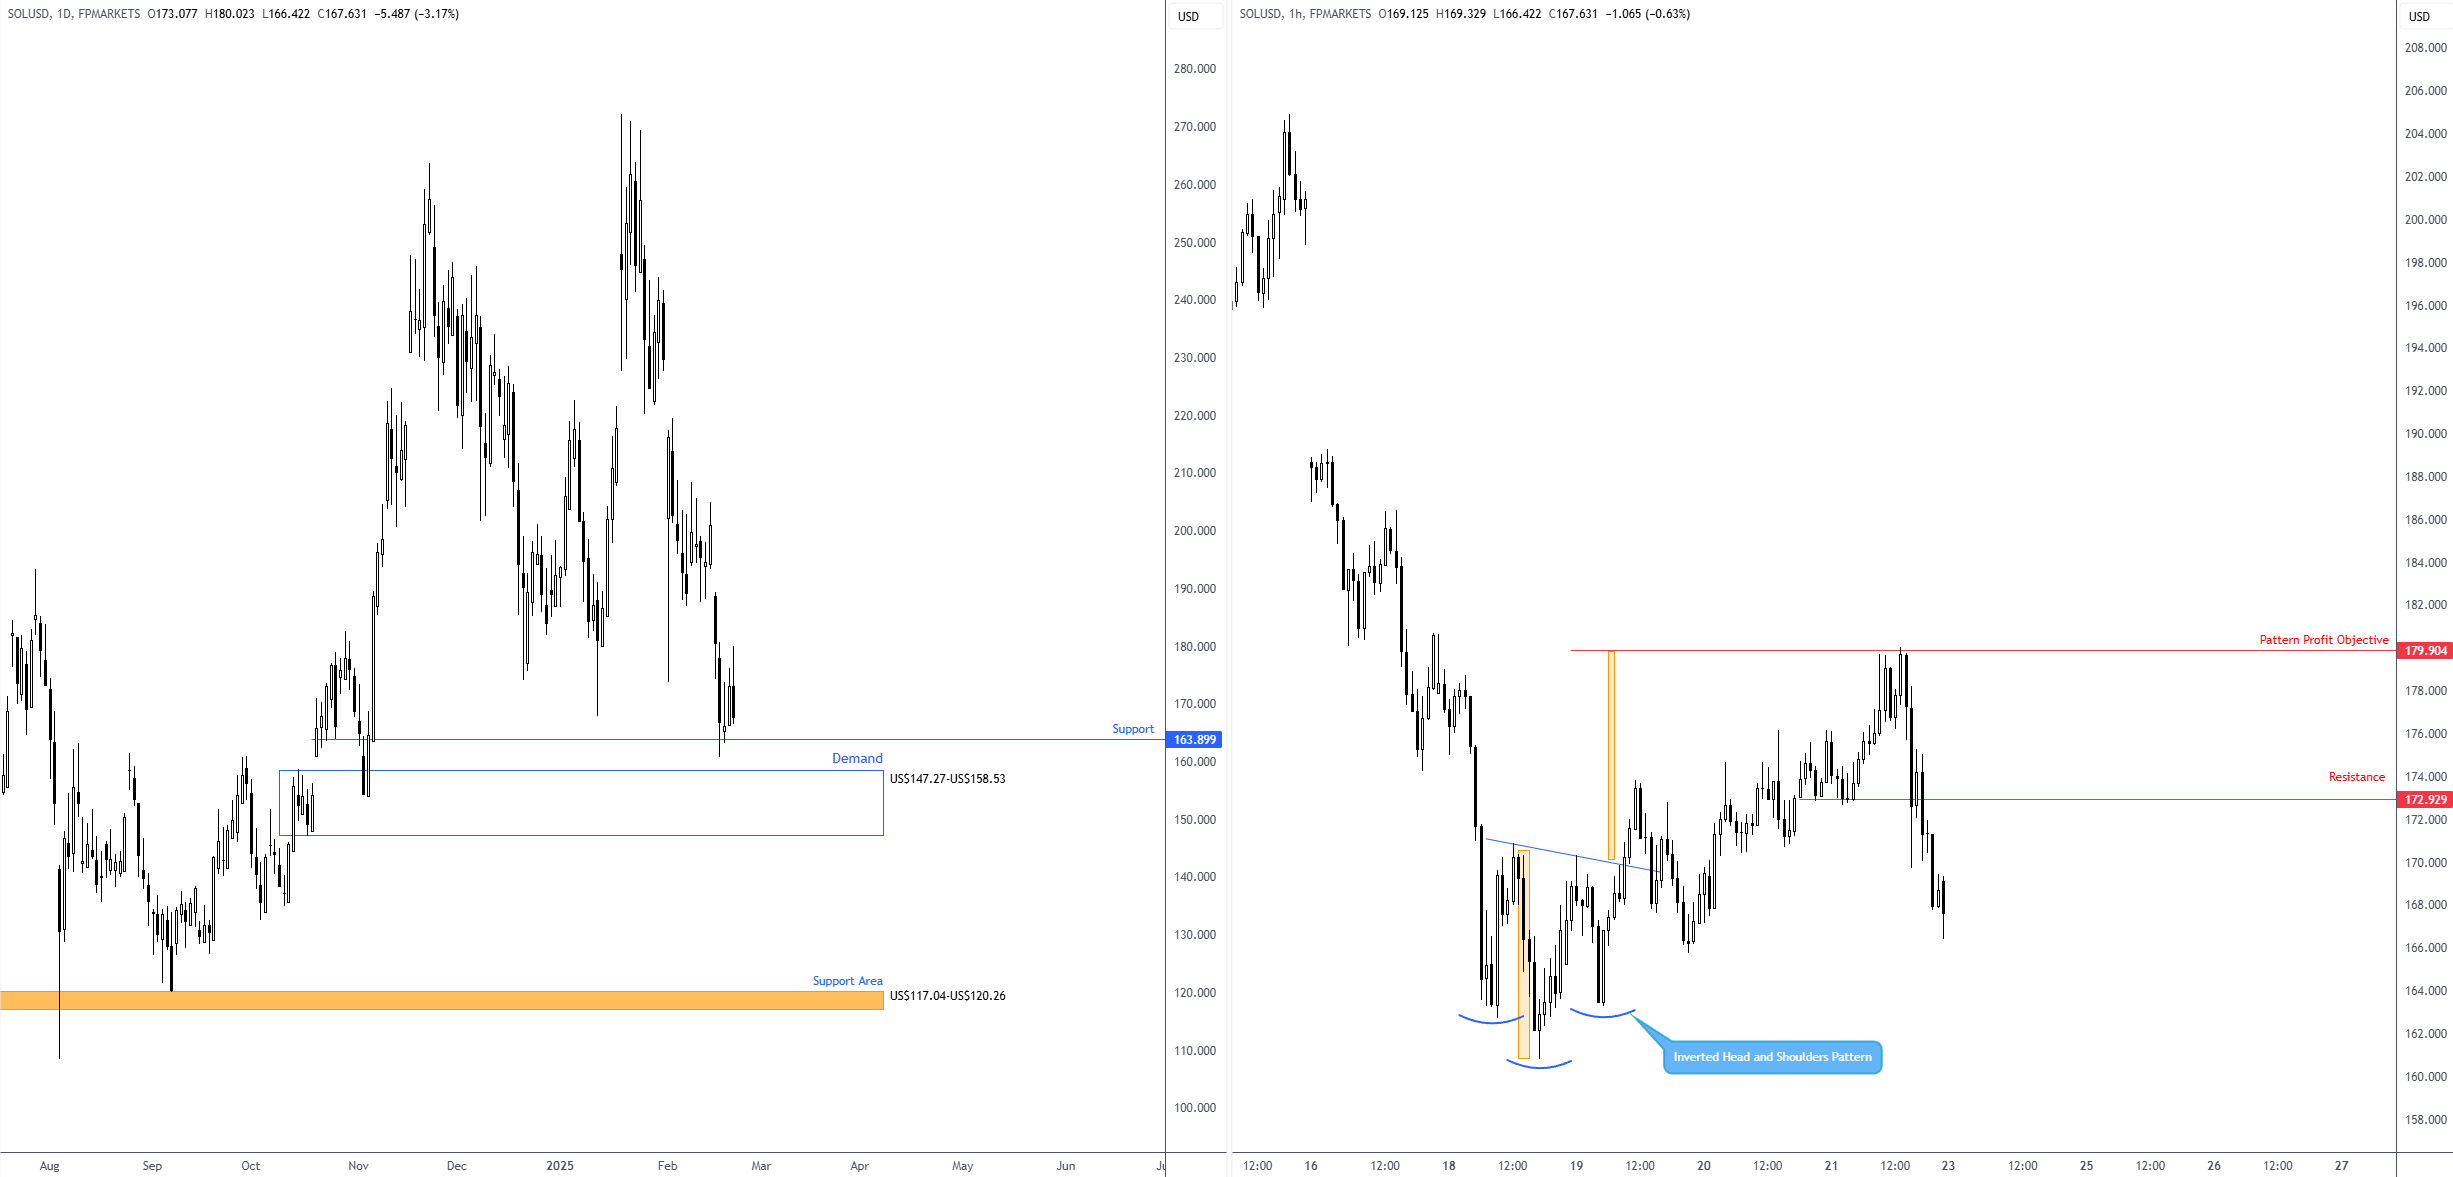
Last week, I highlighted the possibility of a ‘pop’ to the upside on SOL/USD (Solana versus the US dollar). I will not go into detail here, but suffice it to say the trade was backed by daily support from US$163.90; I felt that even though a clear downside bias is in play, the lows around US$174.30ish would provide sufficient liquidity (sell stops beneath the lows) to bolster a short-term rebound from daily support. Coupled with a completed inverted head and shoulders pattern on the H1 timeframe, this was a ‘no-brainer’ technical long opportunity towards the pattern’s profit objective at US$179.90.
As you can see, the aforementioned trade played out as expected, and bears resumed control at the tail end of last week. Since 2025 has been trending downward, a break of current daily support could now be on the radar. Arguably, buyers may step in from demand at US$147.27-US$158.53, located just below, but because the area already welcomed buyers in November 2024, it may be vulnerable. Were price to navigate below this base, I see limited ‘active’ support until between US$117.04 and US$120.26.
As a result of the above analysis, my outlook for SOL/USD is bearish. H1 resistance at 172.93, therefore, could be a location to monitor closely at the start of the week for a possible sell-on-rally scenario.
Author

Aaron Hill
FP Markets
After completing his Bachelor’s degree in English and Creative Writing in the UK, and subsequently spending a handful of years teaching English as a foreign language teacher around Asia, Aaron was introduced to financial trading,


