Volatility is only getting started

S2N spotlight
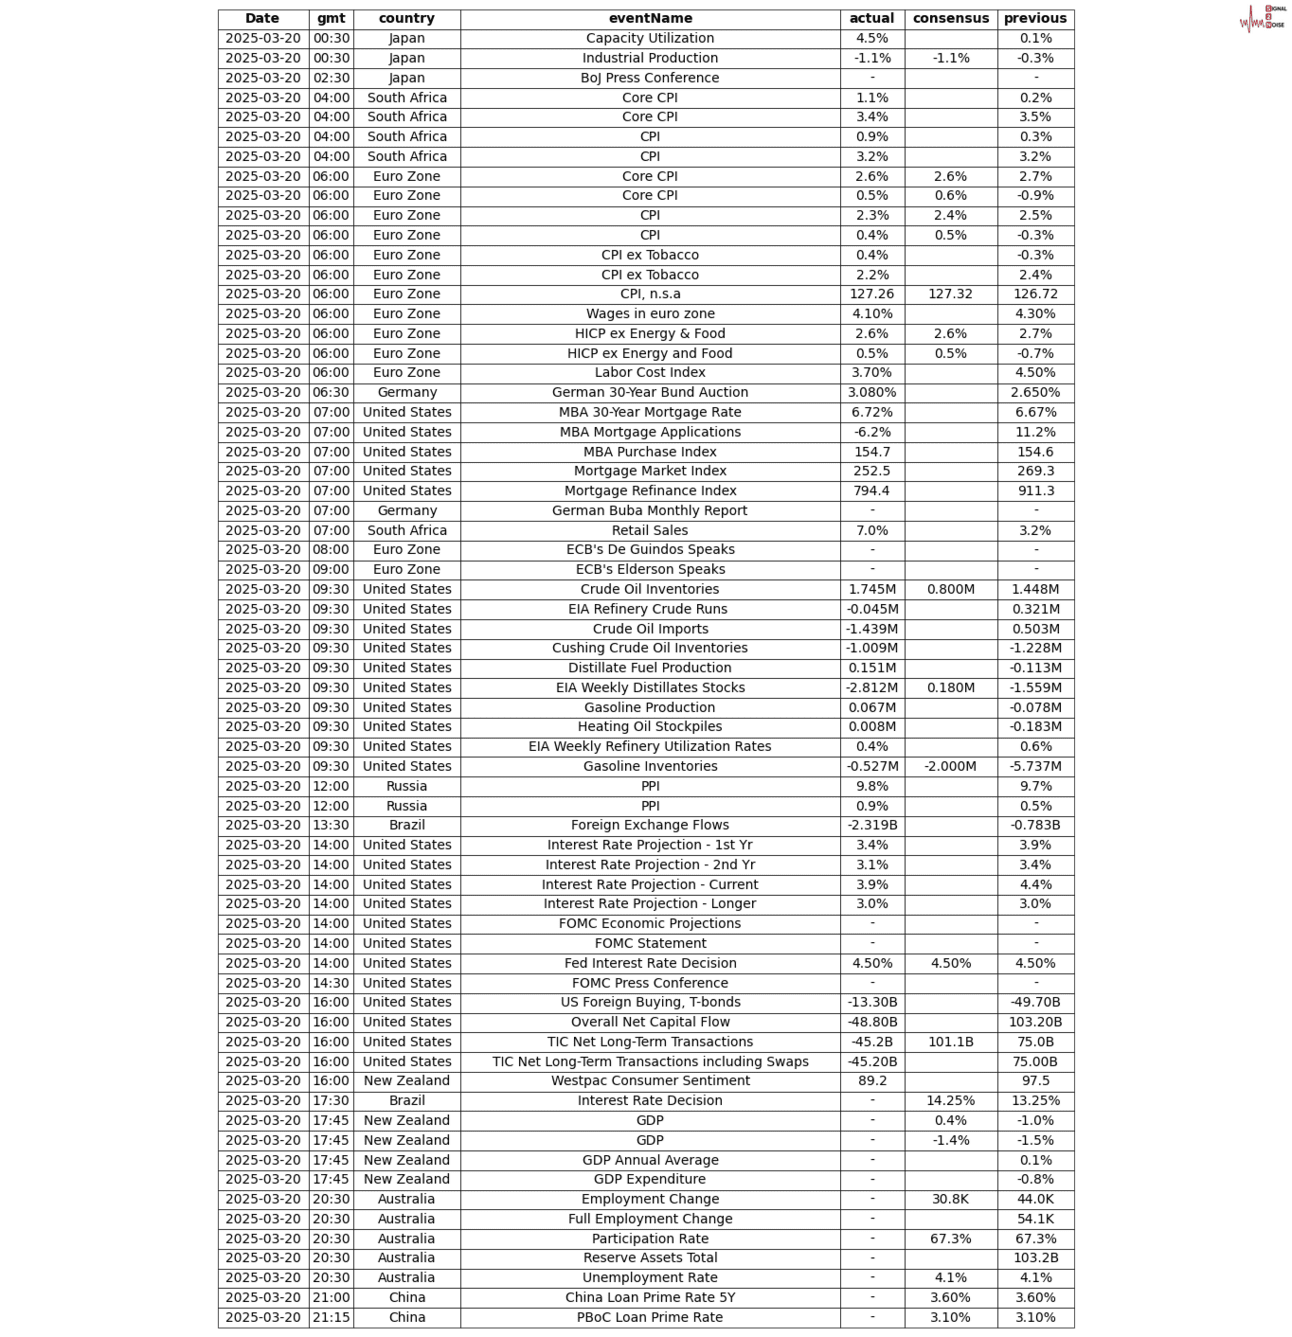
As mentioned yesterday, my view on the Fed coming back to QE to help keep interest rates low was explicitly stated by Chair Powell, where he paired back the runoff of the Fed’s on balance sheet bonds slowing down QT (quantitative tightening), which can be seen as QE re-starting.
The Fed also lowered its GDP forecasts and raised its projected core CPI. Hold on tight. Volatility is only getting started. I previously shared a note on ATR (average true range), another version of measuring volatility. I prefer this measure as it includes the noise of the day. This is especially important if you are trading on margin.

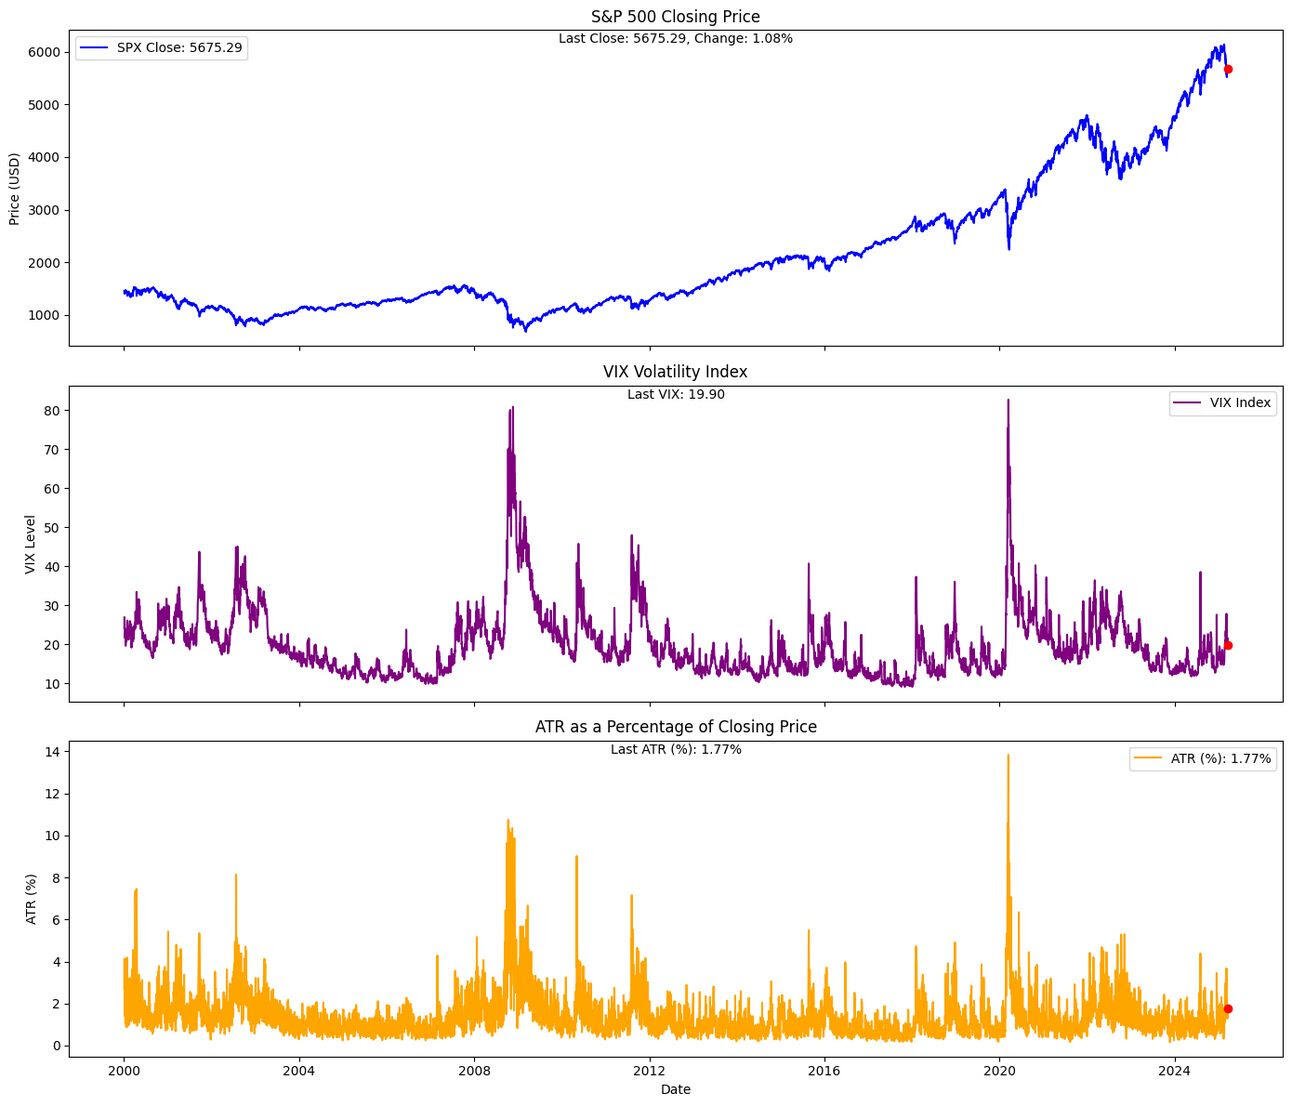
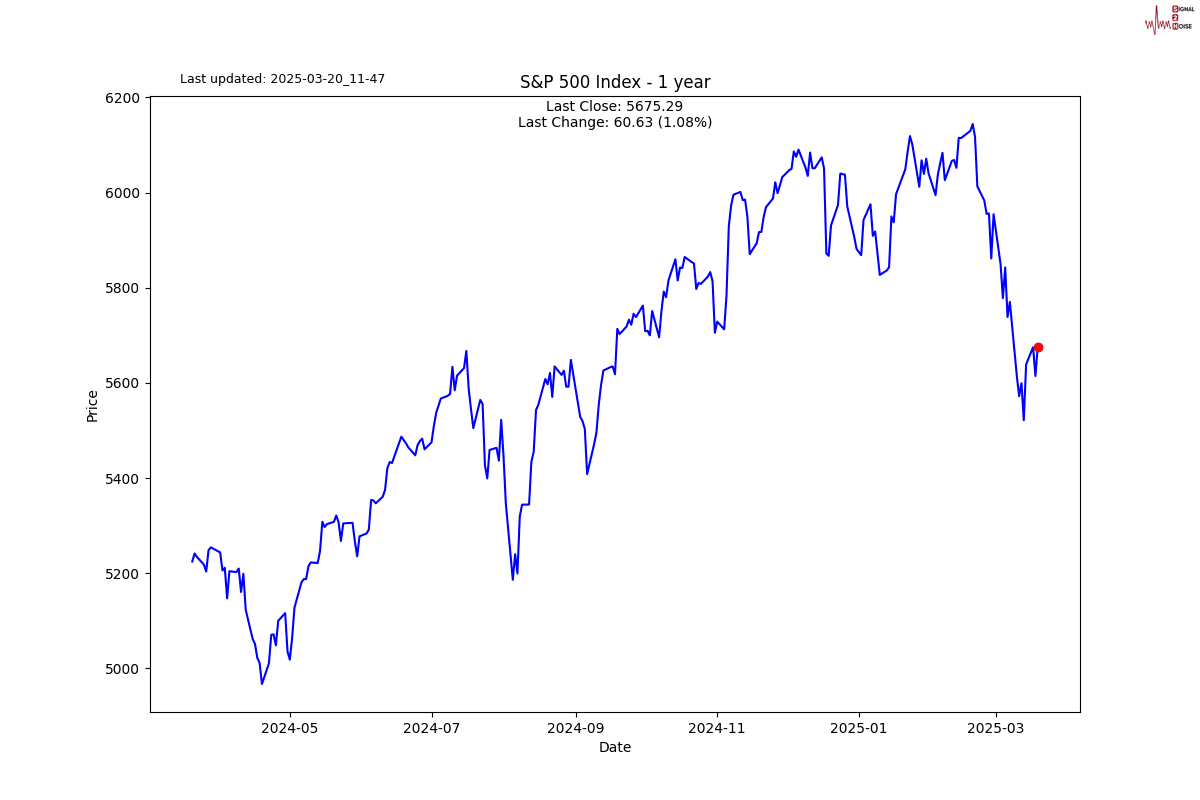
The daily range on the S&P 500 is 1.77% a day.
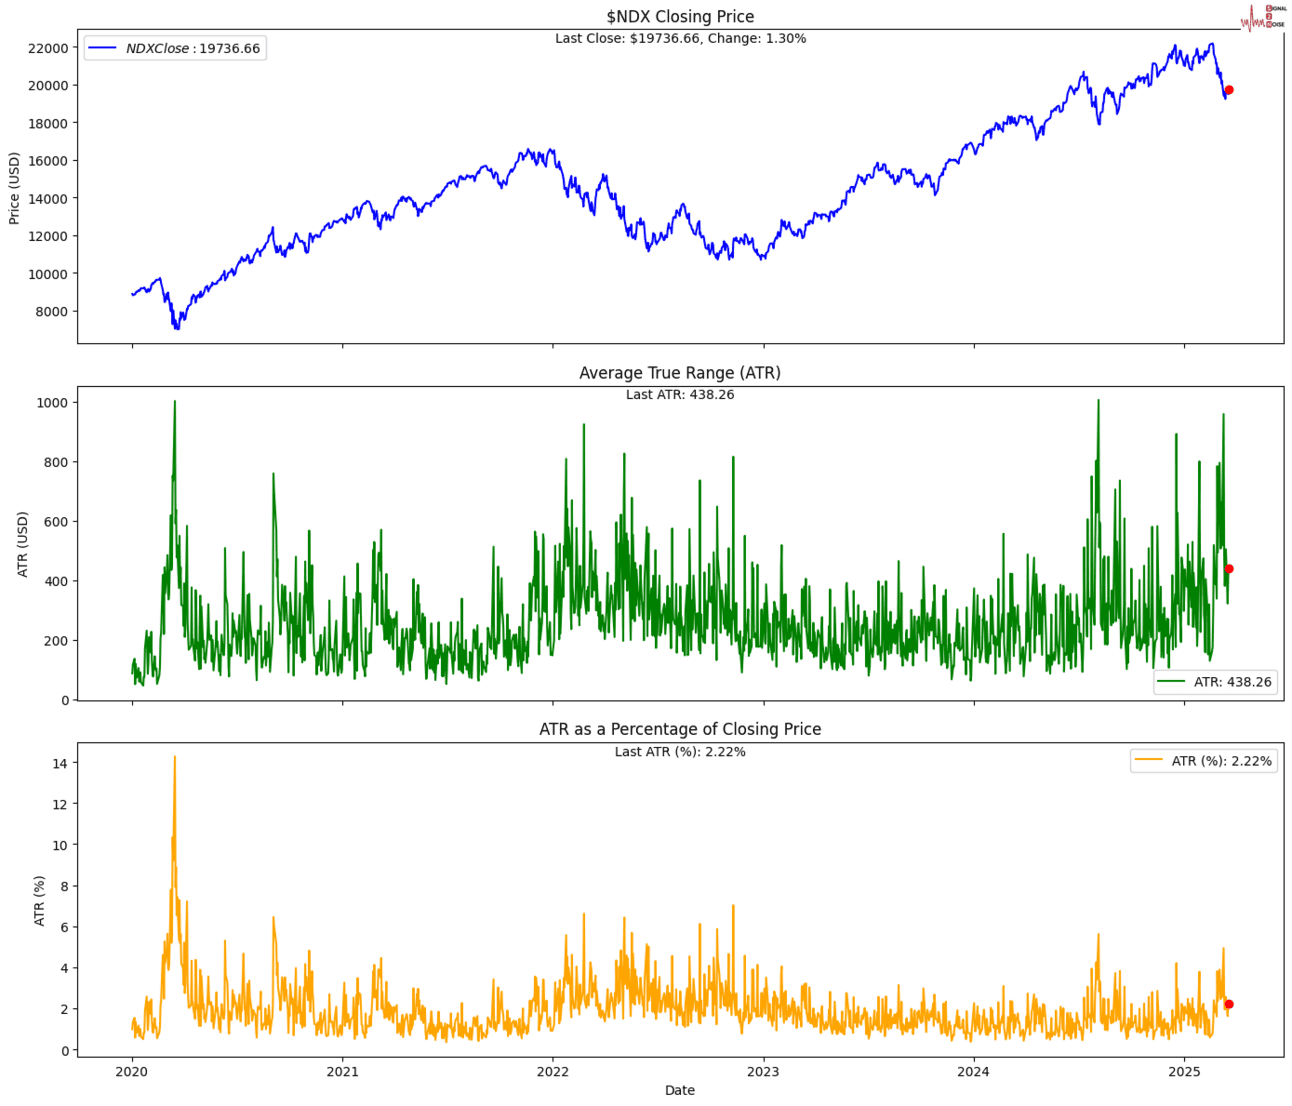
The daily range on the Nasdaq 100 is 2.2% a day.
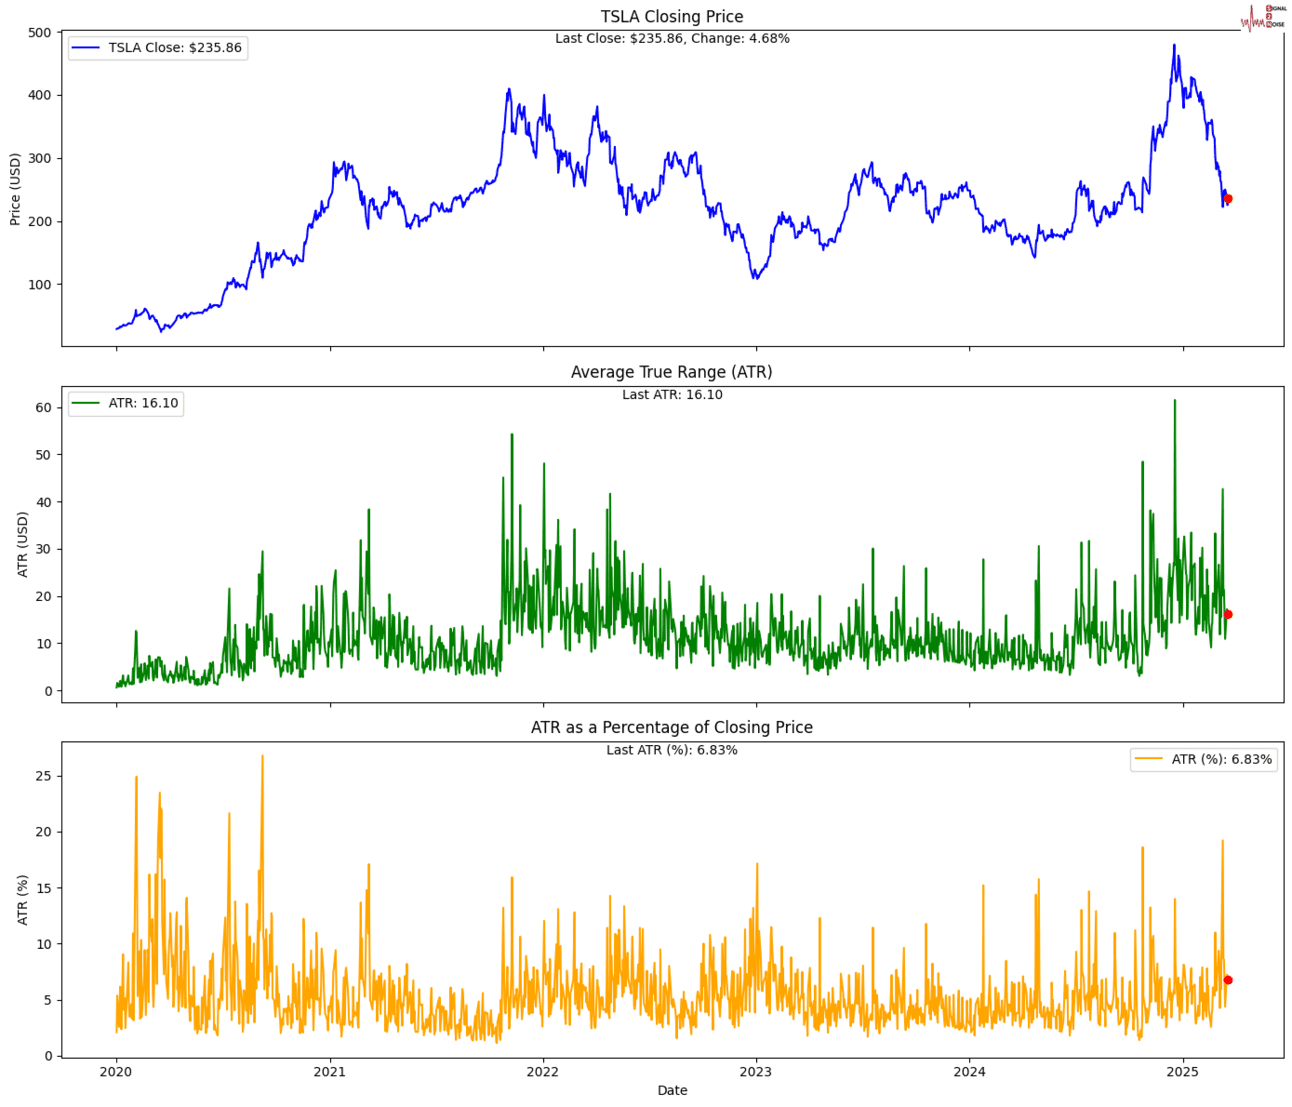
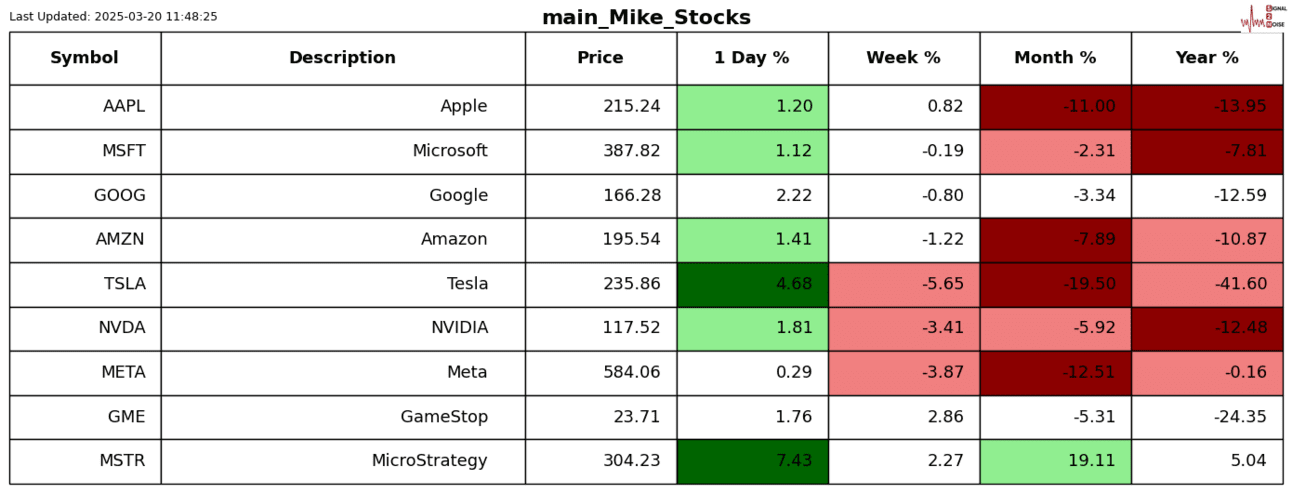
The daily range on Tesla is 6.8% a day.
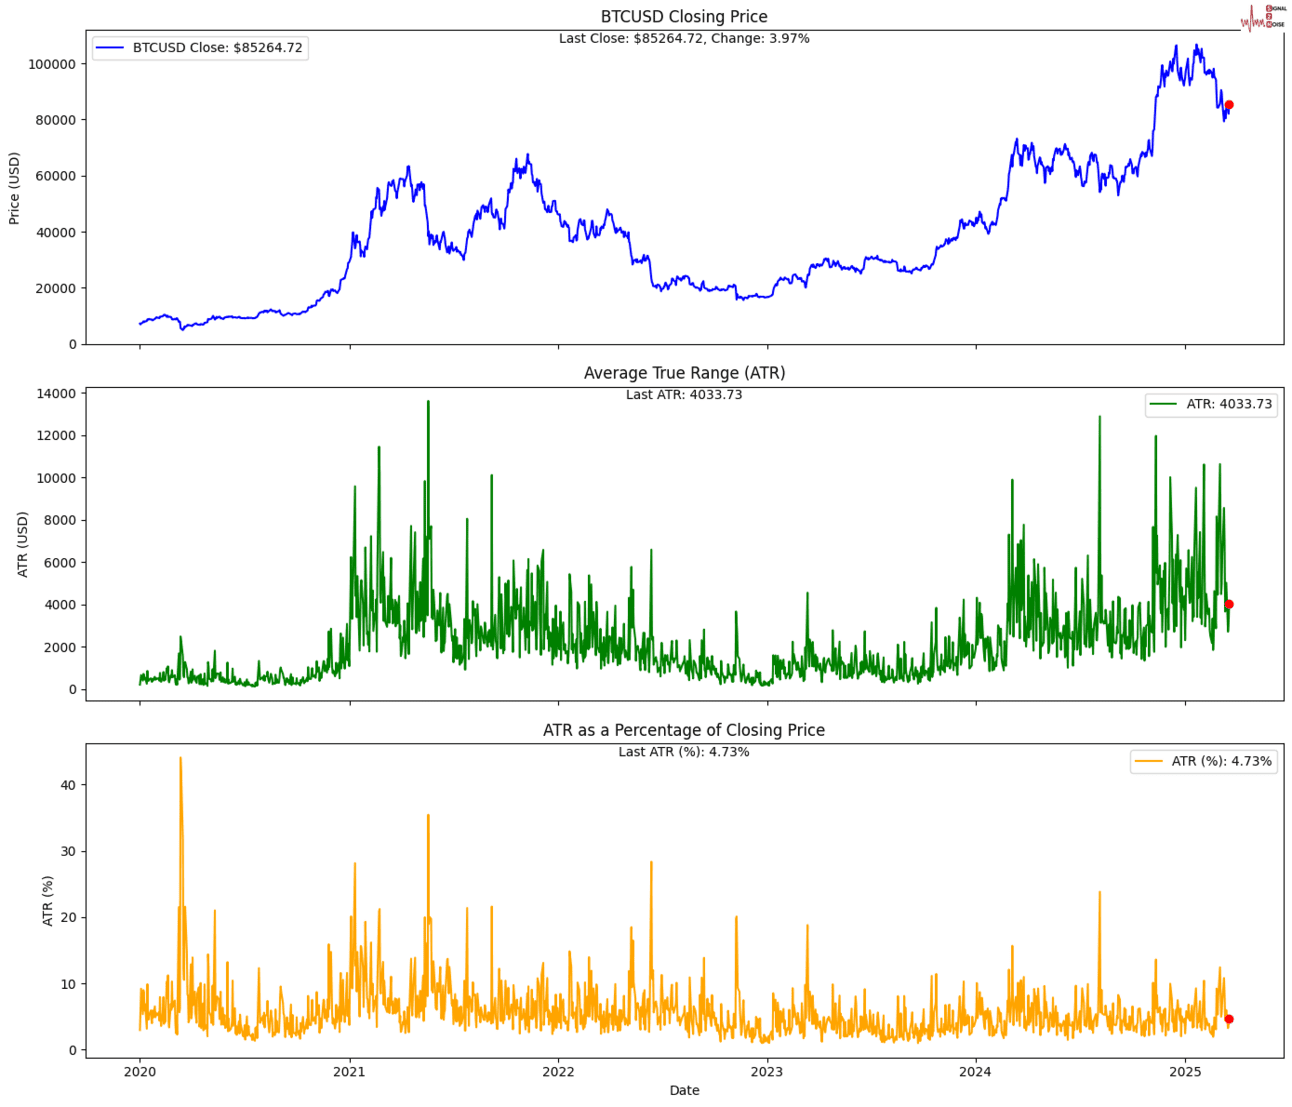
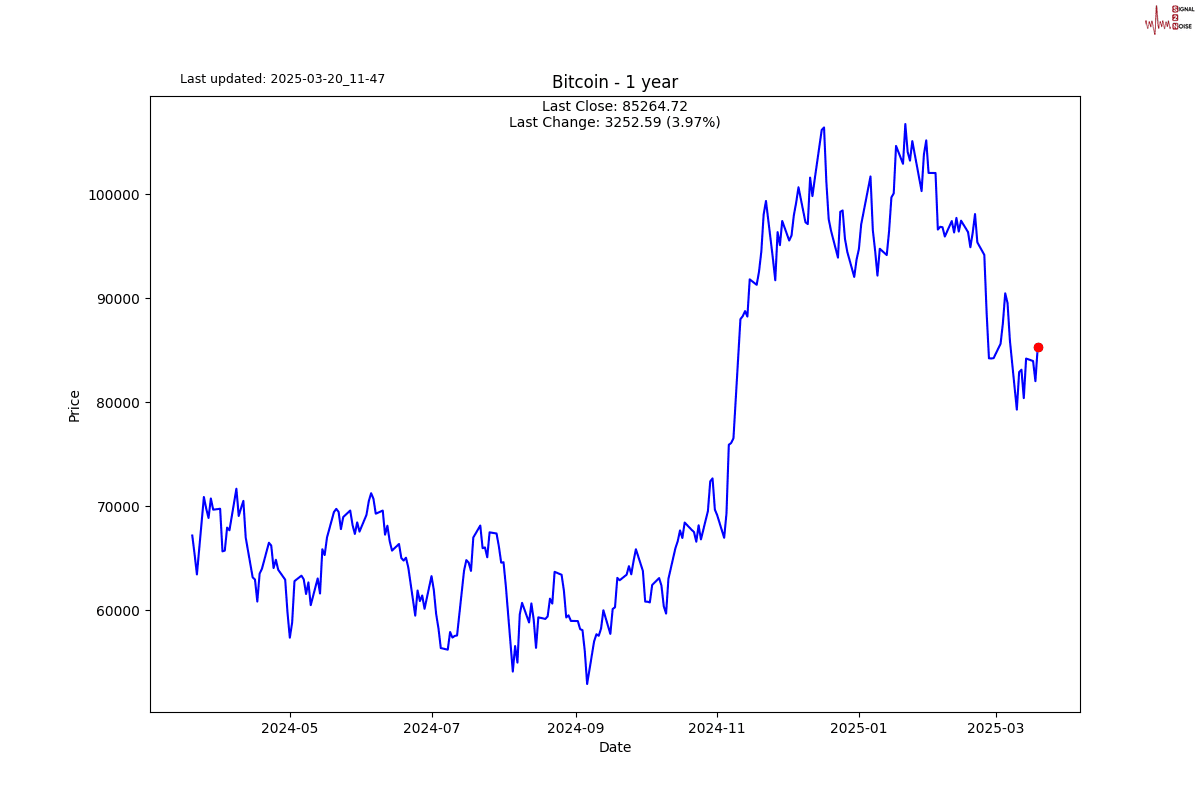
The daily range on Bitcoin is 4.7% a day.
You can see the ATR in points or % in the chart. What is interesting is that all the above charts show ATR dropping quite a lot over the last few days. In case you were wondering how the VIX and ATR look together, I saved you the suspension.
S2N observations
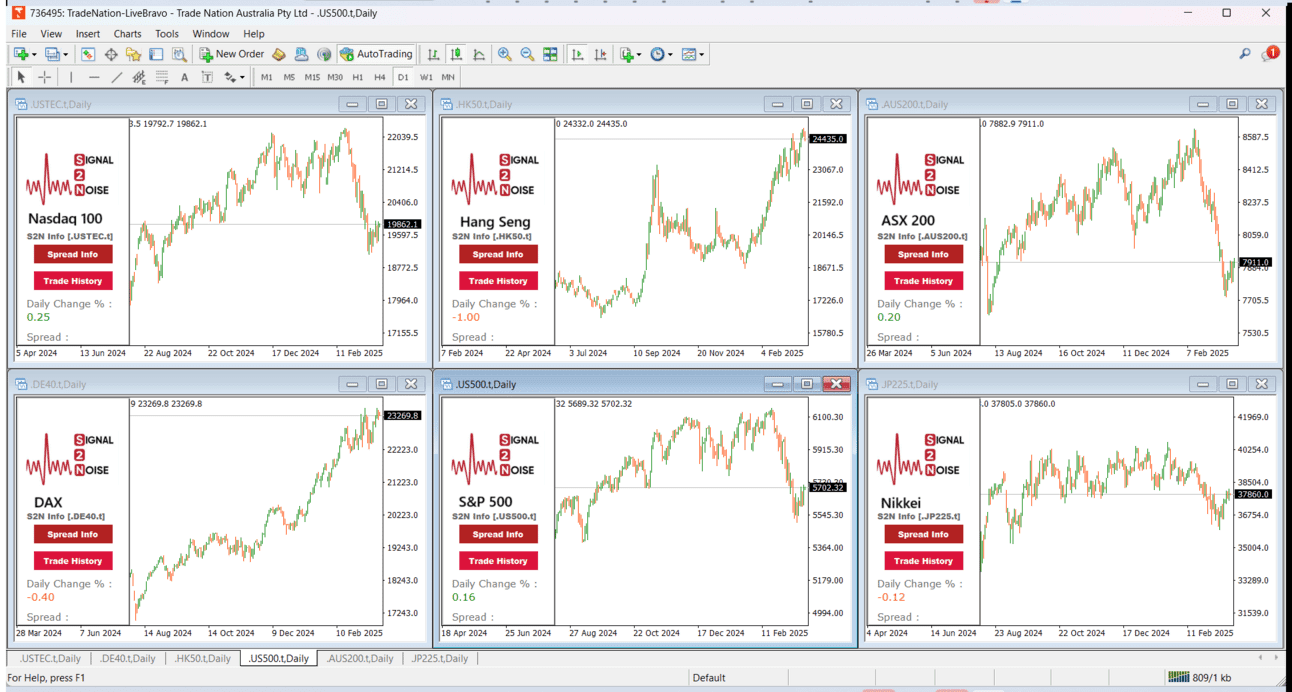
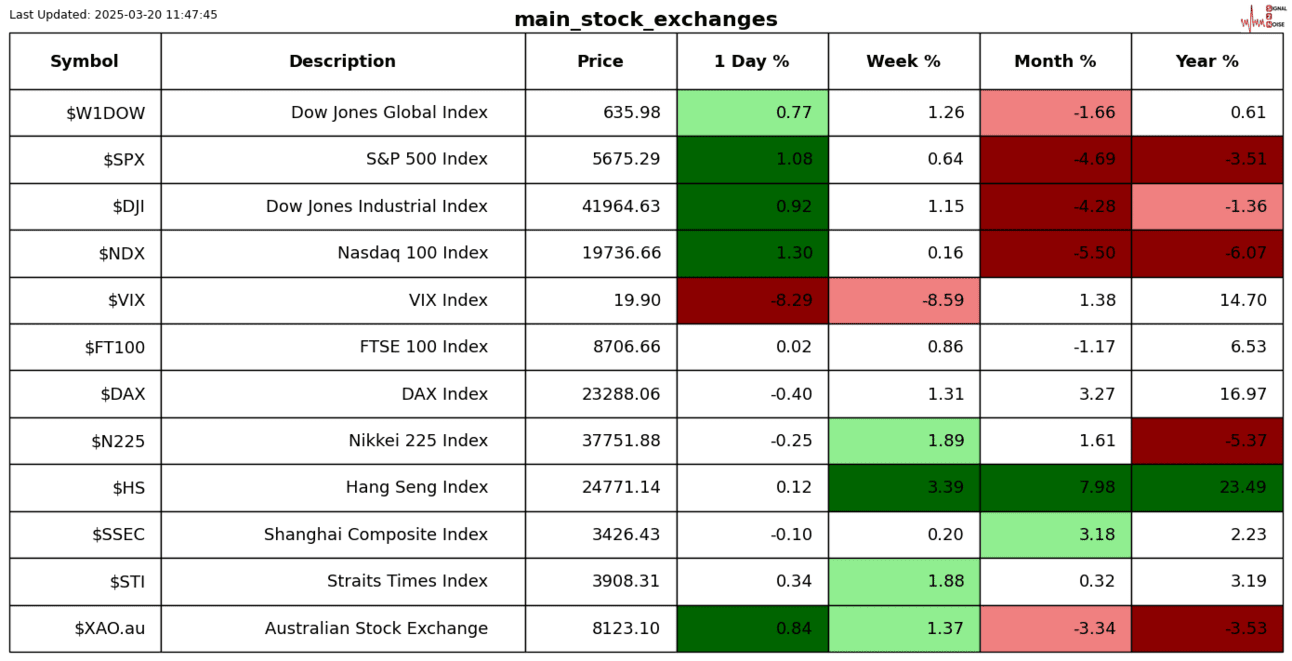
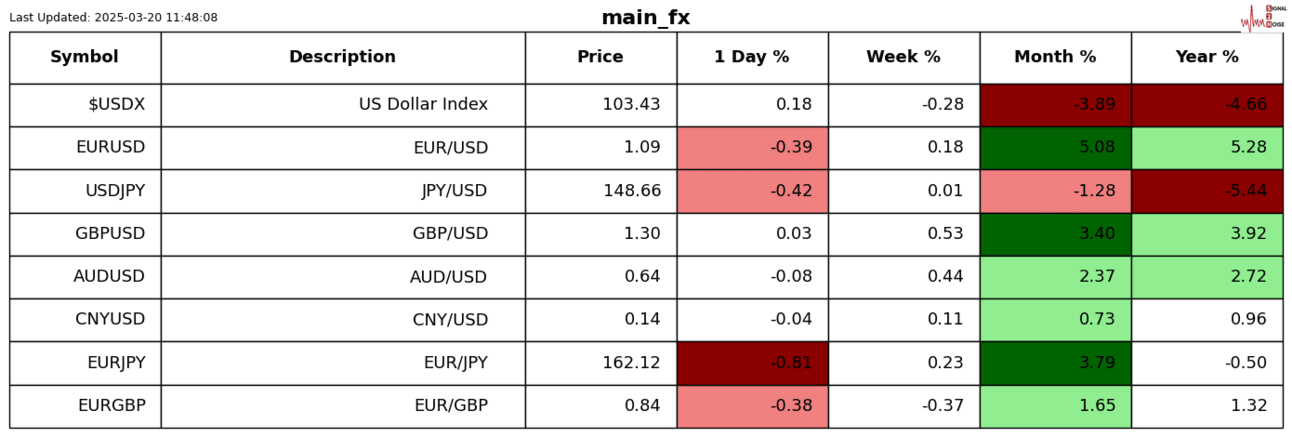
For a change, I thought I would look at some of the main global stock indices in a grid for comparative purposes. You can trade these indices and many more instruments with our sponsor, Trade Nation. You get access to free real-time data as well. What you see is a mixed bag of performance. The Hang Seng and the DAX are making new all-time highs, and the S&P 500, Nasdaq, Australian 200, and Nikkei are well off their highs.
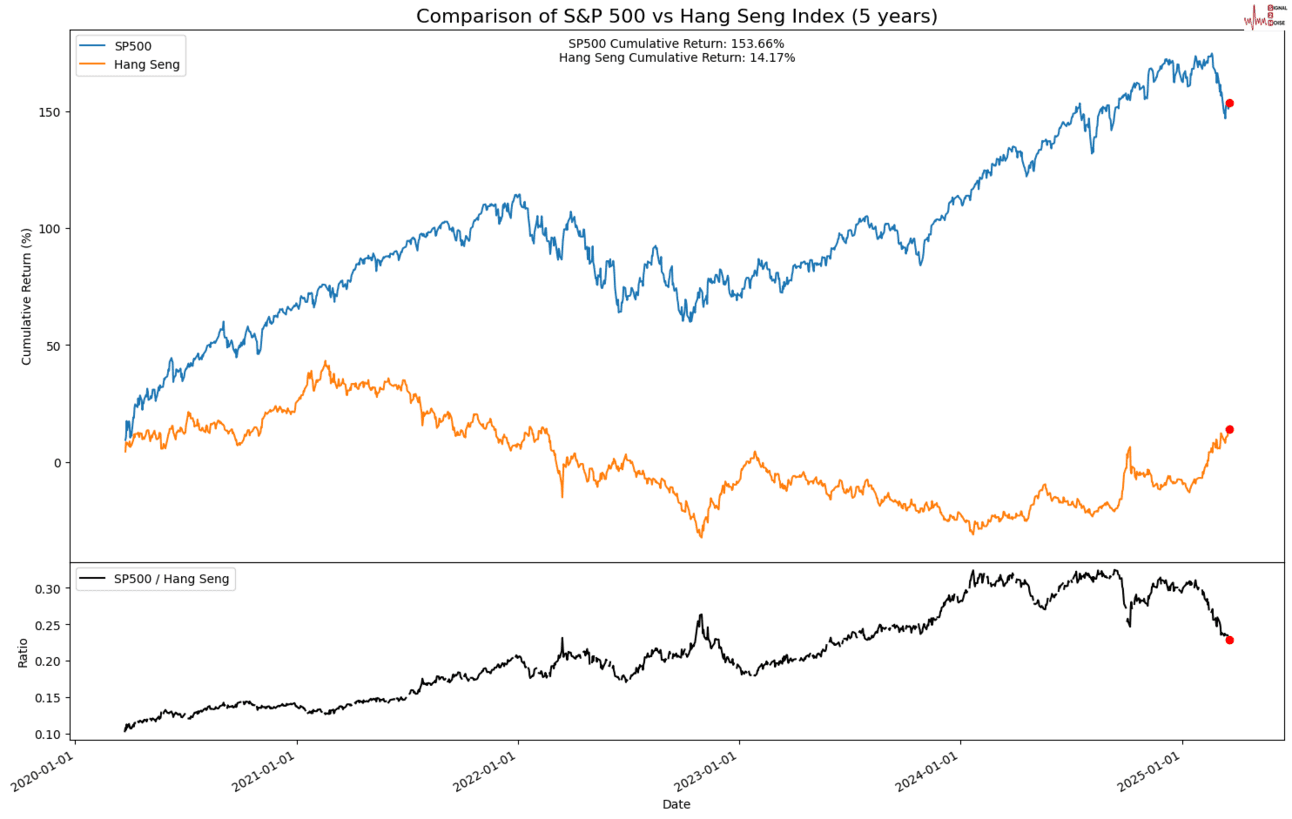
Time to revisit the one contrarian call I made many months ago, which seemed like financial suicide at the time. My China trade by going long Hang Seng and short the S&P 500 is paying off well. Look at the ratio (black line) at the bottom. It is half way there.
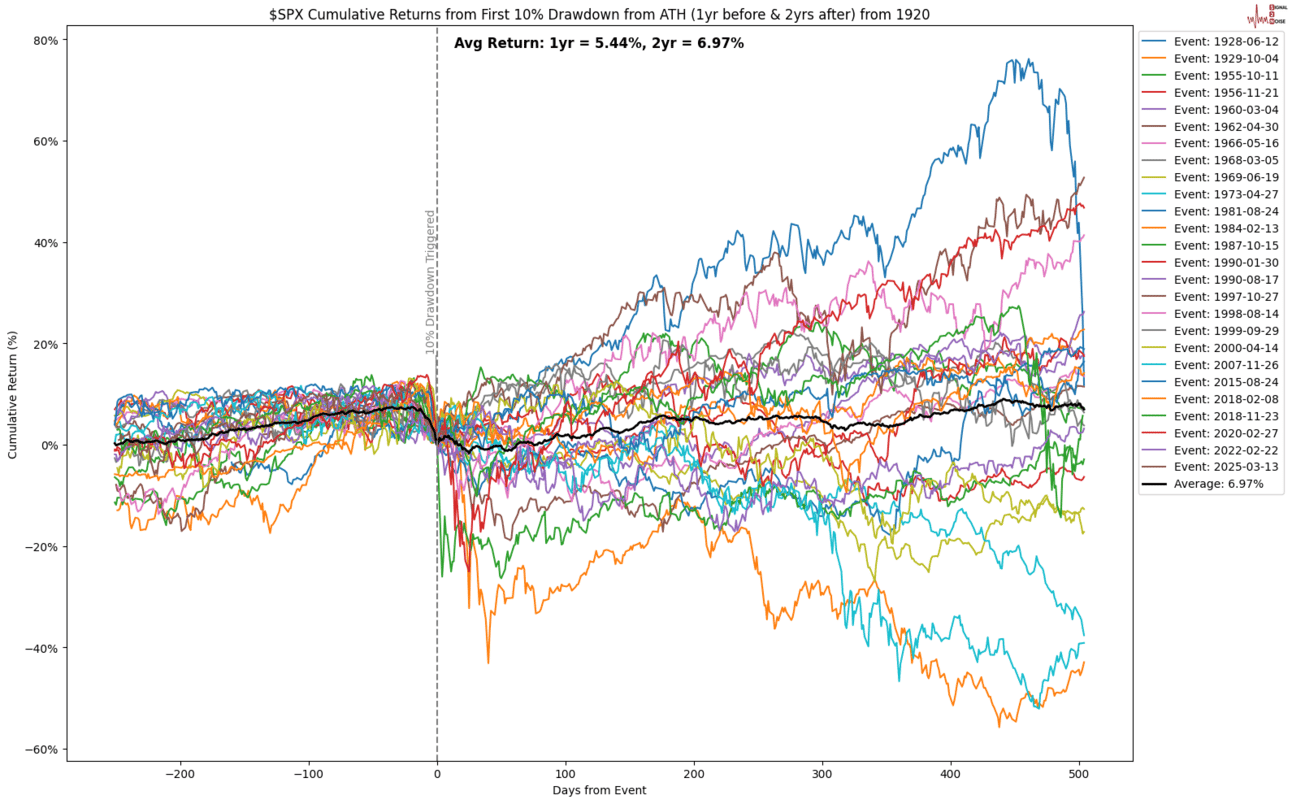
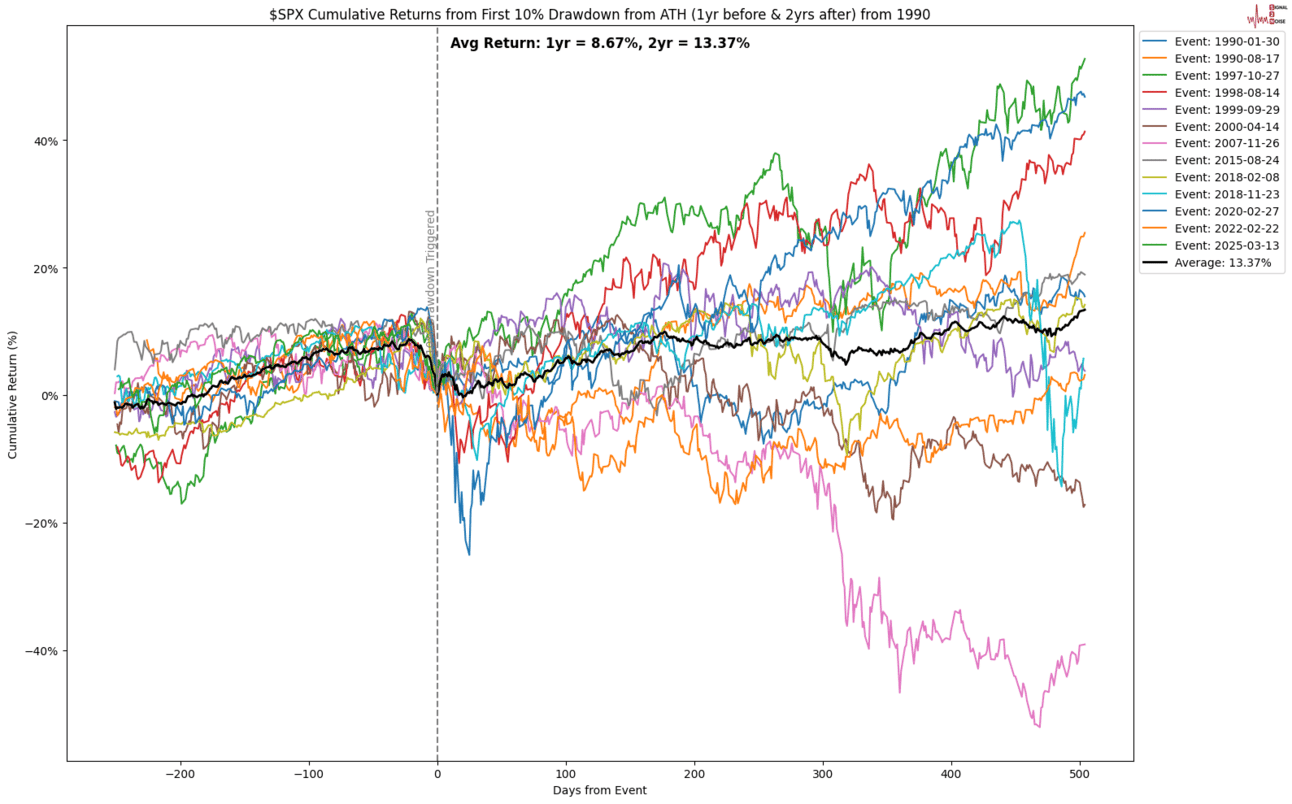
Just something else to think about. I have 2 charts where the S&P 500 has a 10% drawdown from an all-time high. I do a study going back to 1920 and one going back to 1990. The buy the dip cheerleaders will all be telling you that on average you do very well.
Things look even better with the shorter dataset.
The key point here is that it is a good strategy on average, but it happens very seldomly, and there are some times where there are some really nasty drops. So beware of buying the dip.
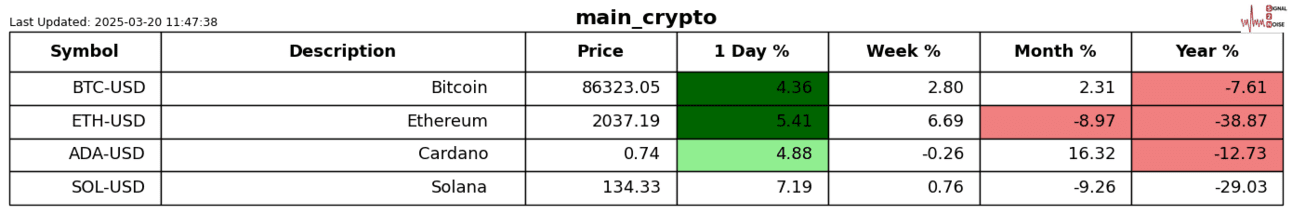
One last observation was XRP won their case against the SEC. Some times I wonder what these government agencies are doing with their power and resources. A quiet win for the crypto industry and another step forward to a world with less overregulation.
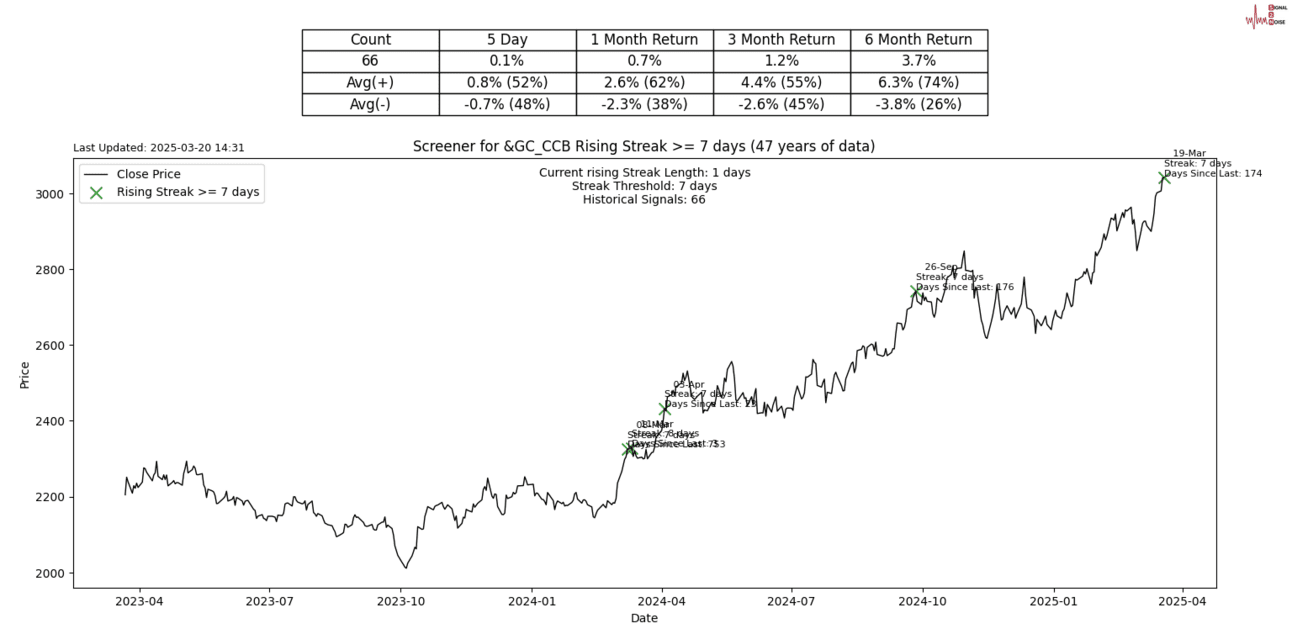
S2N screener alert
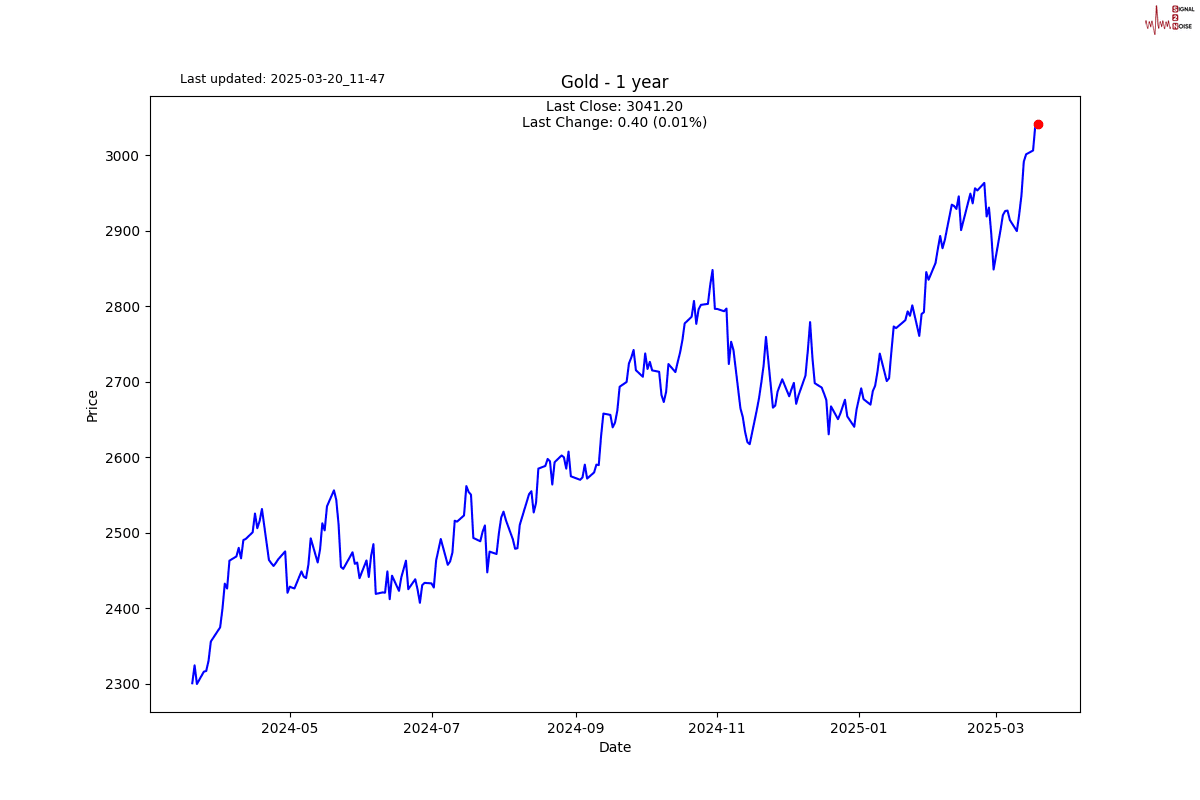
Gold futures up 7 days in a row.
S2N performance review
S2N chart gallery
S2N news today
Author

Michael Berman, PhD
Signal2Noise (S2N) News
Michael has decades of experience as a professional trader, hedge fund manager and incubator of emerging traders.


