Using a moving average as support: Gold, GBP/USD, 200 AUD technical analysis

Gold
They say a bad workman blames his tools.
Quite often, good work means using the right tools.
In a trend you need to use trend-following tools - and the most famous technical indicator is the moving average.
When it's a fast-moving trend, you need to use averages taken over shorter periods.
Likewise, a slower trend needs averages taken over longer periods.
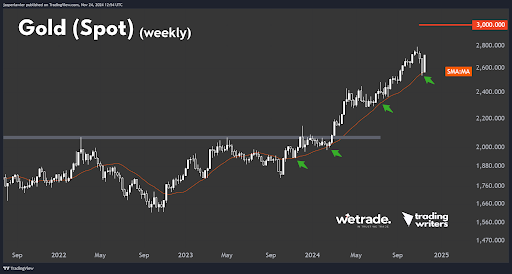
Gold has just bounced off the 20-week moving average for the fourth time. The market is clearly benchmarking this trend according to this specific average.
So, while the price is above this moving average the trend is intact - and when it eventually breaks it will be an important signal that the strength of the trend has weakened - and could be about to reverse.
On the daily chart a rising trendline has broken but we would argue the reason the rebound off the low has been so strong is because the price rebounded off the 20-week moving average.
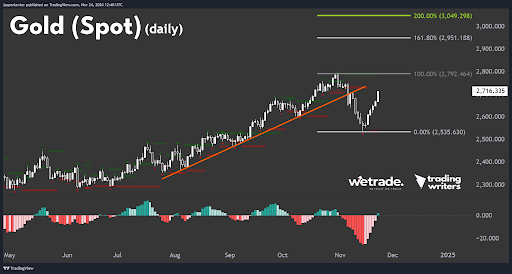
For now our bias is bullish but there are no good risk: reward opportunities to buy and it remains unclear whether the short term uptrend can continue after the trendline break.
GBP/USD
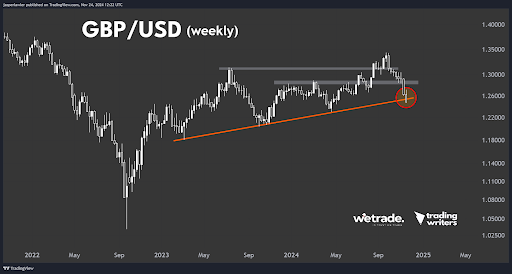
Cable has now lost nearly 1000 pips in a matter of weeks in a heavy sell-off.
We’ve been watching the rising trendline connecting the last three major swing lows on the weekly candlestick chart- and it just broke with a weekly close below it.
This is an indication the long-term trend has turned bearish for GBP/USD.
The daily chart shows the downtrend will remain intact while below 1.26 and could target the yearly low at 1.235.
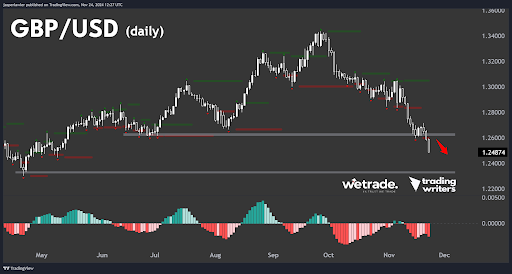
Bullish divergence on the MACD in combination with the oversold trend could lead to a bullish reversal in the near term but with the broken long term weekly trendline - it seems any bullish rebound would offer a chance to rejoin the new long term downtrend.
200 AUD
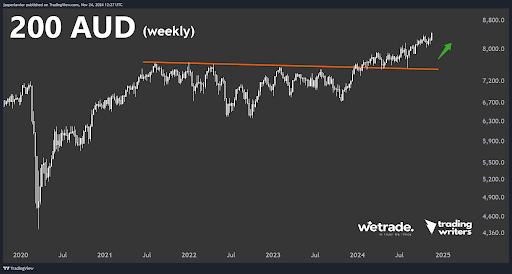
Australia’s benchmark stock index is hitting record highs
On the weekly chart we can see the index broke out of a 2-year resistance level and while above there, our bias remains bullish on 200 AUD.
The latest break to new highs comes after a correction in the index that rebounded off a long term rising trendline on the daily chart.
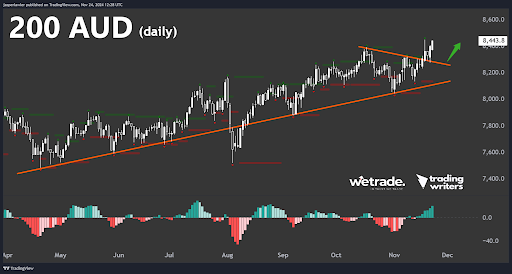
As such, the short term uptrend is in line with the long term uptrend while above this rising trendline.
Jasper Lawler writes this article on behalf of WeTrade
Author

Jasper Lawler
Trading Writers
With 18 years of trading experience, Jasper began his career as a stockbroker on Wall Street in New York City before sharpening his analytical skills at top trading firms in the City of London.


