|

US Dollar at resistance zone ahead of US Inflation report

USDOLLAR – The Dollar Index Dow Jones chart from FXCM is a basket chart, which was developed by traders for traders allowing you to take advantage of US Dollar appreciation or depreciation with precise tracking and maximum liquidity. The index basket is designed to be as easy to understand as it is to trade. It reflects the change in value of the US dollar measured against a basket of the most liquid currencies in the world: AUSSIE Dollar, EURO, British POUND and Japanese YEN.

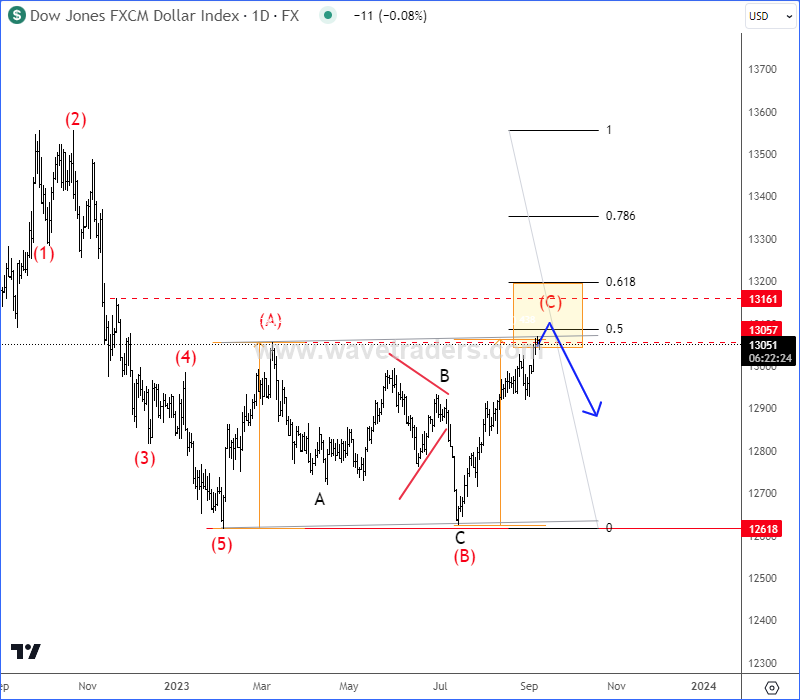
From Elliott wave perspective USDOLLAR chart is trading at resistance zone for wave (C) of an (A)-(B)-(C) flat correction. So, ahead of important US CPI inflation report next week, be aware of limited rise and watch out, as bears may show up again at the end of 2023.

USDOLLARd

Get Full Access To Our Premium Elliott Wave Analysis For 14 Days. Click here.

Author

Gregor Horvat

Gregor Horvat

Wavetraders

Experience Grega is based in Slovenia and has been in the Forex market since 2003.

More from Gregor Horvat
Share:

Editor's Picks

EUR/USD recedes to daily lows near 1.1850

EUR/USD keeps its bearish momentum well in place, slipping back to the area of 1.1850 to hit daily lows on Monday. The pair’s continuation of the leg lower comes amid decent gains in the US Dollar in a context of scarce volatility and thin trade conditions due to the inactivity in the US markets.

GBP/USD resumes the downtrend, back to the low-1.3600s

GBP/USD rapidly leaves behind Friday’s decent advance, refocusing on the downside and retreating to the 1.3630 region at the beginning of the week. In the meantime, the British Pound is expected to remain under the microscope ahead of the release of the key UK labour market report on Tuesday.

Gold looks inconclusive around $5,000

Gold partially fades Friday’s strong recovery, orbiting around the key $5,000 region per troy ounce in a context of humble gains in the Greenback on Monday. Additing to the vacillating mood, trade conditions remain thin amid the observance of the Presidents Day holiday in the US.

Bitcoin consolidates as on-chain data show mixed signals

Bitcoin price has consolidated between $65,700 and $72,000 over the past nine days, with no clear directional bias. US-listed spot ETFs recorded a $359.91 million weekly outflow, marking the fourth consecutive week of withdrawals.

The week ahead: Key inflation readings and why the AI trade could be overdone

It is likely to be a quiet start to the week, with US markets closed on Monday for Presidents Day. European markets are higher across the board and gold is clinging to the $5,000 level after the tamer than expected CPI report in the US reduced haven flows to precious metals.

XRP steadies in narrow range as fund inflows, futures interest rise

Ripple is trading in a narrow range between $1.45 (immediate support) and $1.50 (resistance) at the time of writing on Monday. The remittance token extended its recovery last week, peaking at $1.67 on Sunday from the weekly open at $1.43.