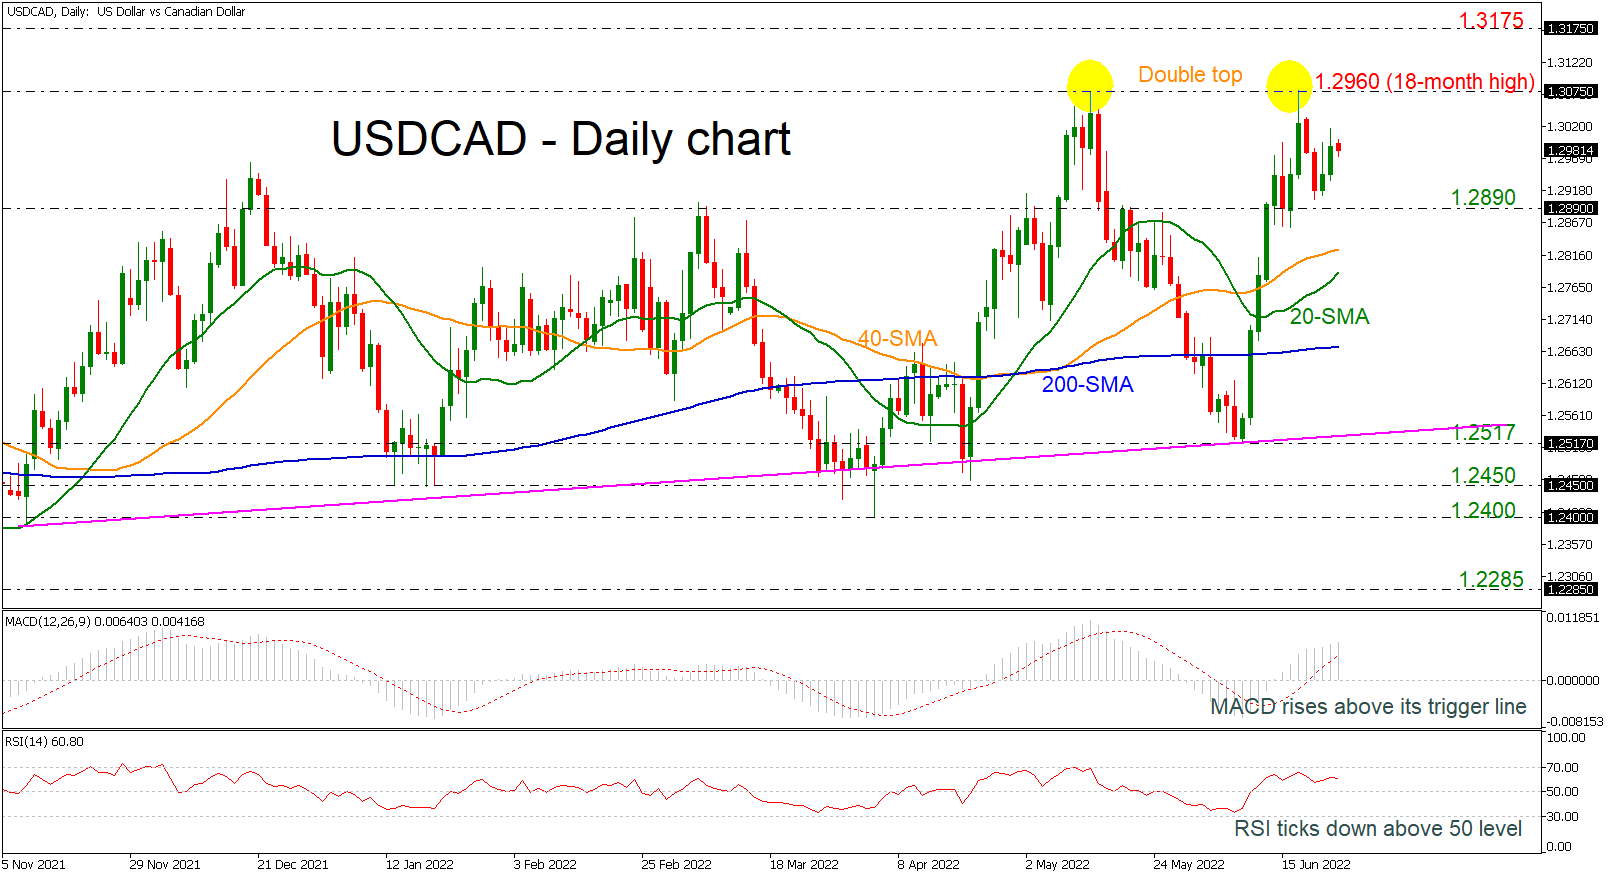
USD/CAD shows weak signs below double top at 1.2960
USDCAD is showing some weak signs today with the technical indicators confirming this view. The RSI indicator is moving south in the positive region, while the MACD oscillator is holding above its trigger and zero lines, but with softer momentum than before.
The price posted a double top around the 18-month high of 1.2960 in the previous weeks and any moves higher could boost the long-term bullish outlook. Moving up, the price may meet the 1.3175 barrier, taken from the peak of November 2020, ahead of the 1.3420 level, registered in September 2020.
On the other hand, if the price heads down, immediate support could come from the 1.2980 support and the 40- and 20-day simple moving averages (SMAs) at 1.2825 and 1.2785, respectively. A drop lower may drive the bears until the flat 200-day SMA at 1.2660 before tumbling to 1.2517.
All in all, USDCAD has been in an advancing mode over the last seven months, though only a significant climb above the double top may endorse this positive outlook.
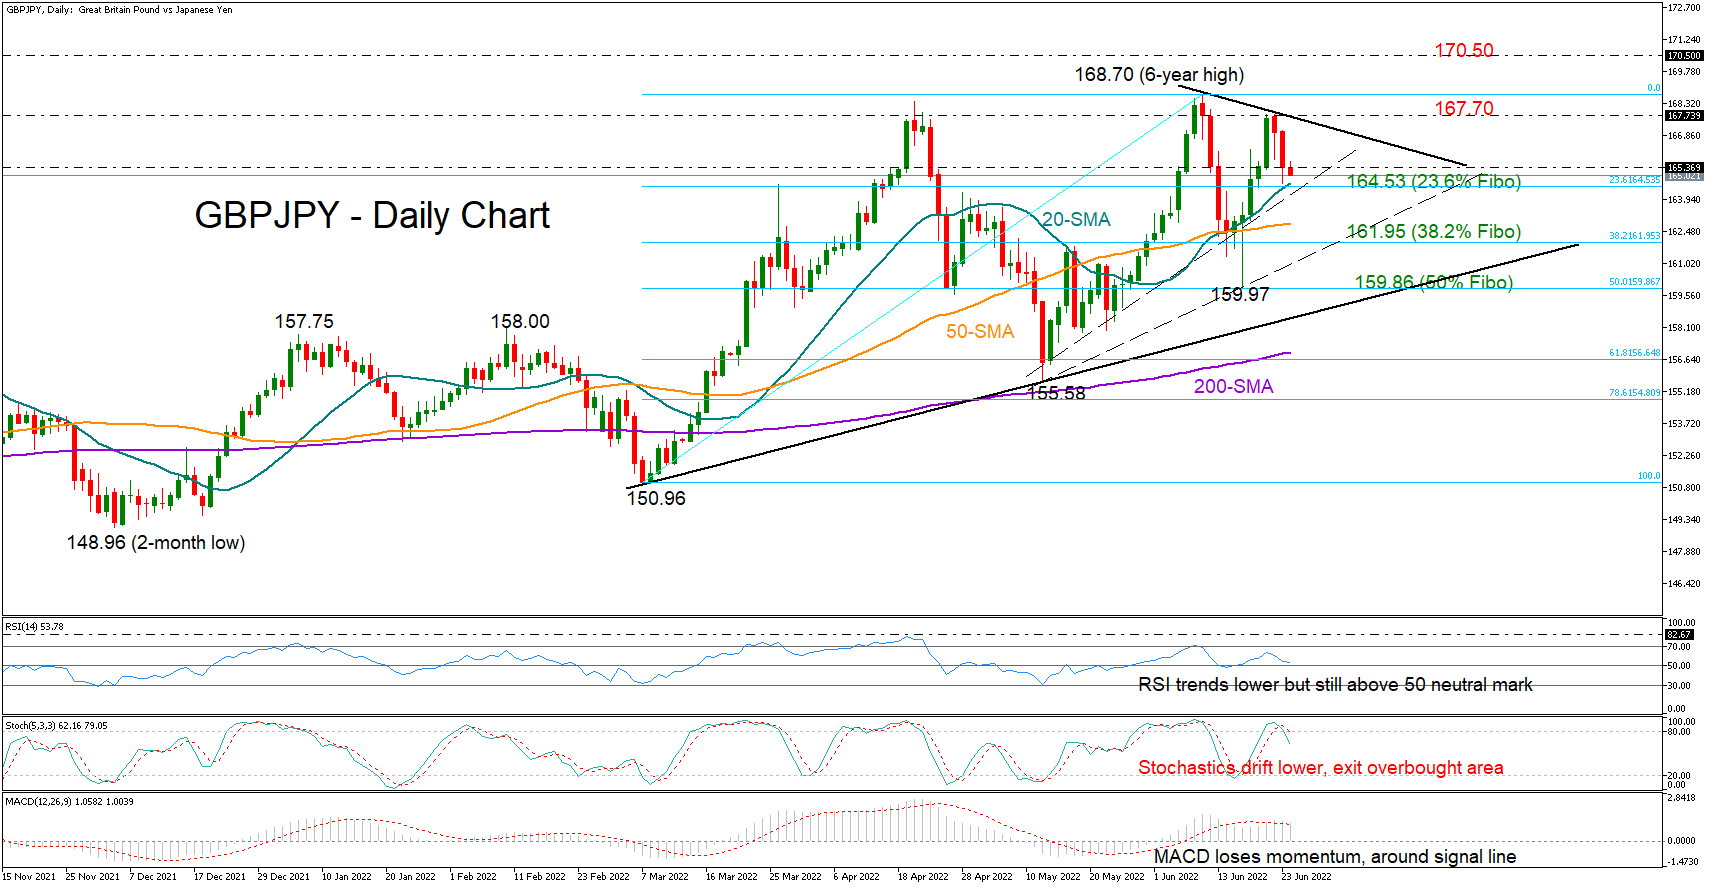
GBP/JPY bullish trend dims
GBPJPY is mirroring fading buying interest as negative momentum escalated on Thursday, confirming a lower high at 167.82.
Similarly, the RSI seems to be following a negative trajectory after failing to reach its previous high, while the negative turn in the Stochastics and the MACD is also reflecting some discomfort among traders.
Optimism, however, has not completely vanished as the 20-day simple moving average (SMA), which has been a crucial support region over the past week, is still intact. The 23.6% Fibonacci retracement of the 150.96 – 168.70 upleg is also in the same neighborhood at 164.53 along with a dashed ascending trendline. If selling tendencies, however, break that floor, the 50-day SMA currently at 162.11 may immediately come under the spotlight ahead of the 50% Fibonacci of 161.95. Slightly lower, a tentative upward-sloping trendline may attract some attention around 161.00 before traders target the 61.8% Fibonacci of 159.86.
Alternatively, should the 20-day SMA cease downside pressures, the pair may push for a close above the short-term tentative resistance trendline and the 167.70 former restrictive zone. In case the bulls accelerate above the six-year high of 168.70 too, the next barricade may pop up somewhere near 170.50 taken from January-February 2016.
In brief, the positive trend in GBPJPY seems to be losing steam, though the bulls may not give up the battle yet unless the base at 164.53 collapses.
Forex trading and trading in other leveraged products involves a significant level of risk and is not suitable for all investors.
Recommended Content
Editors’ Picks

AUD/USD: The hunt for the 0.7000 hurdle
AUD/USD quickly left behind Wednesday’s strong pullback and rose markedly past the 0.6900 barrier on Thursday, boosted by news of fresh stimulus in China as well as renewed weakness in the US Dollar.

EUR/USD refocuses its attention to 1.1200 and above
Rising appetite for the risk-associated assets, the offered stance in the Greenback and Chinese stimulus all contributed to the resurgence of the upside momentum in EUR/USD, which managed to retest the 1.1190 zone on Thursday.

Gold holding at higher ground at around $2,670
Gold breaks to new high of $2,673 on Thursday. Falling interest rates globally, intensifying geopolitical conflicts and heightened Fed easing bets are the main factors.

Bitcoin displays bullish signals amid supportive macroeconomic developments and growing institutional demand
Bitcoin (BTC) trades slightly up, around $64,000 on Thursday, following a rejection from the upper consolidation level of $64,700 the previous day. BTC’s price has been consolidating between $62,000 and $64,700 for the past week.

RBA widely expected to keep key interest rate unchanged amid persisting price pressures
The Reserve Bank of Australia is likely to continue bucking the trend adopted by major central banks of the dovish policy pivot, opting to maintain the policy for the seventh consecutive meeting on Tuesday.

Five best Forex brokers in 2024
VERIFIED Choosing the best Forex broker in 2024 requires careful consideration of certain essential factors. With the wide array of options available, it is crucial to find a broker that aligns with your trading style, experience level, and financial goals.