USD/SGD selling the rallies at the Blue box zone
USD/SGD is another pair that has given us nice trading opportunity lately. The pair has been showing lower low sequences in the cycle from the 1.3531 peak. Recently it made clear 3 waves bounce and found sellers as we were expecting. As our members know when market is trending, blue boxes are very reliable and giving us good trading opportunities. In this technical blog we’re going to take a quick look at the charts of USDSGD published in members area of the website and explain the Elliott Wave structure and trading strategy.
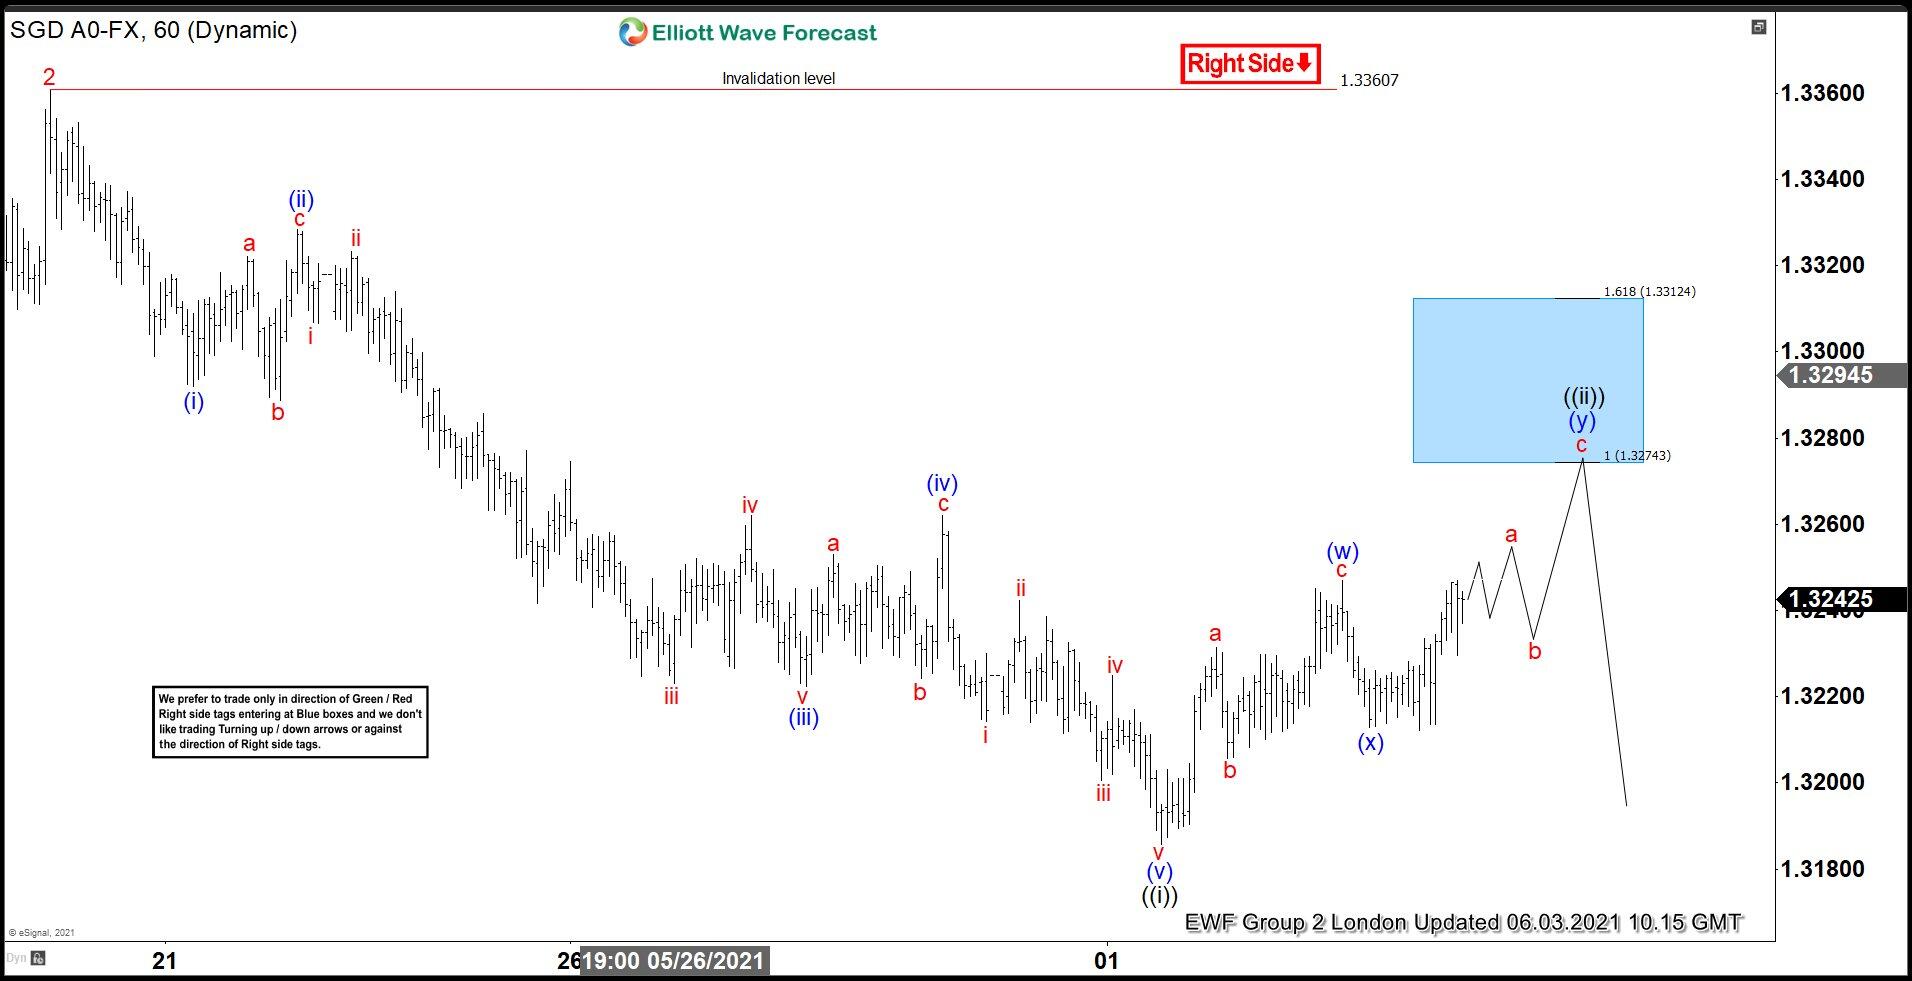
USD/SGD Elliott Wave 1 Hour Chart 6.3.2021
Cycle from the 1.33607 peak shows 5 waves and the pair is now correcting it. Recovery looks incomplete at the moment, suggesting more upside toward Blue Box area: 1.3274-1.3312. At the Blue Box area sellers should ideally appear for further decline or pull back at least. Once the price reaches 50 fibs against the (x) blue low, we should make short positions risk free. As our members know Blue Boxes are no enemy areas, giving us 85% chance to get a reaction.
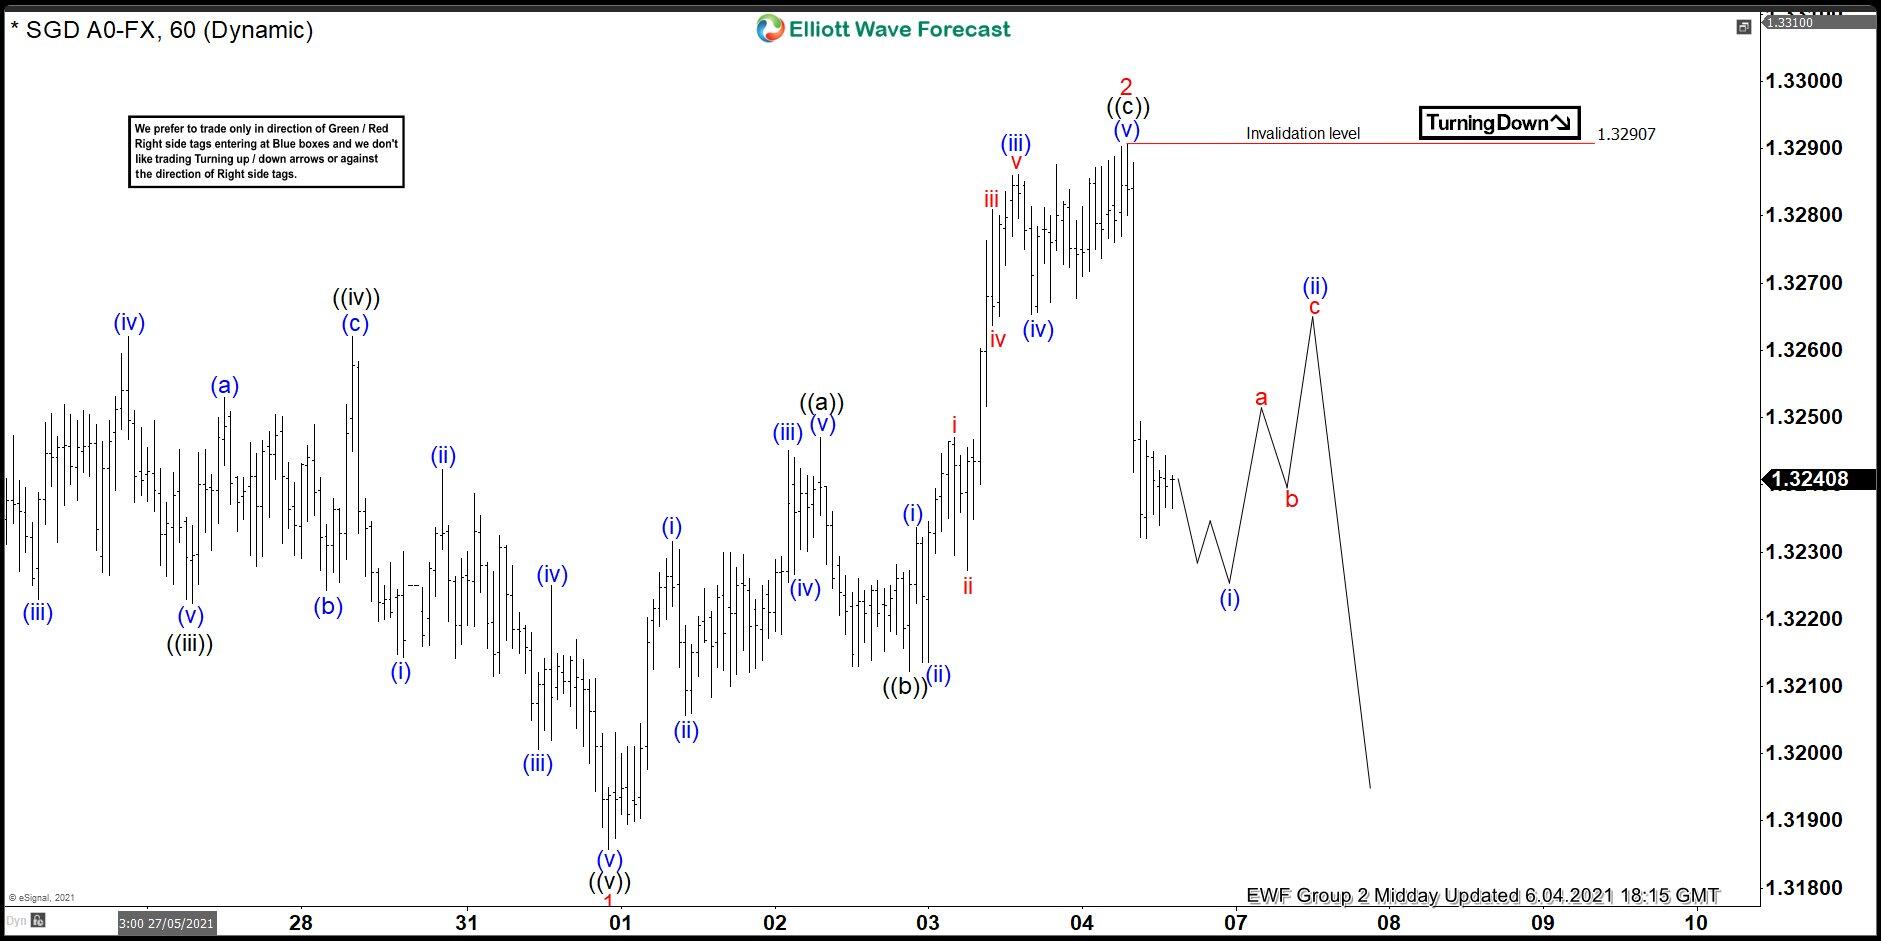
USD/SGD Elliott Wave 1 Hour Chart 6.4.2021
USD/SGD found sellers right at the blue box : 1.3274-1.3312 area. The pair gave us nice decline from there. The price has already reached 50 fibs against the B red low. Members who sold the pair at the blue box area now enjoying profits in a risk free trades. We took partial profits and put Stop Loss at Break Even. Now, we expect to see further separation down from the 8.64407 peak . We would need to see break of 06/01 low to confirm next leg down is in progress. Otherwise if 1.329 pivot gives up, we can still be in the larger recovery.
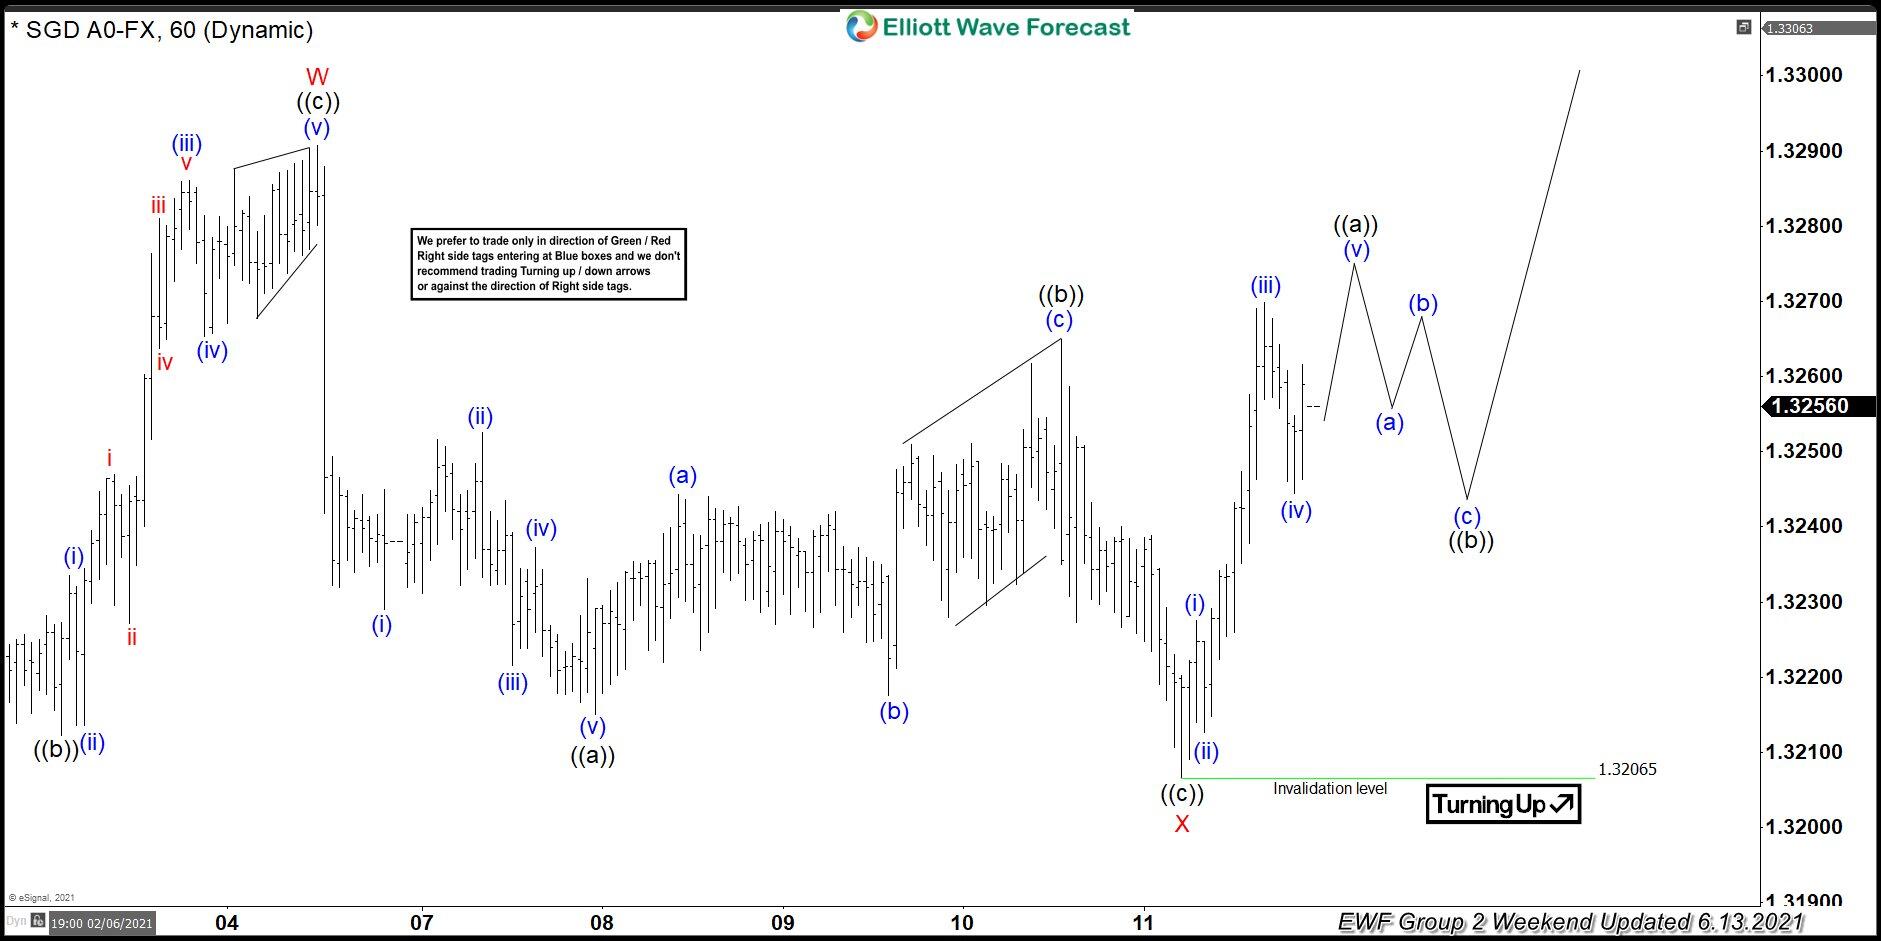
USD/SGD Elliott Wave 1 Hour Chart 6.13.2021
At this stage we see 03.31 cycle completed in Dollar index. Consequently USDSGD can also have equivalent cycle completed. The pair can be also doing larger correction toward 1.33029-1.33267 area. At that zone we expect sellers to appear again for a 3 waves pull back at least.
Keep in mind market is dynamic and presented view could have changed in the mean time. You can check most recent charts in the membership area of the site. Best instruments to trade are those having incomplete bullish or bearish swings sequences.
Author

Elliott Wave Forecast Team
ElliottWave-Forecast.com


