Will market correlation and debt ceiling compromise drive upside momentum?

USD: Jun '23 is Down at 104.090.
Energies: Jul '23 Crude is Up at 68.13.
Financials: The Jun '23 30 Year T-Bond is Down 14 ticks and trading at 127.29.
Indices: The Jun '23 S&P 500 emini ES contract is 32 ticks Higher and trading at 4198.50.
Gold: The Jun'23 Gold contract is trading Down at 1977.05. Gold is 44 ticks Lower than its close.
Initial conclusion
This is not a correlated market. The USD is Down, Crude is Up which is normal, and the 30 Year T-Bond is trading Lower. The Financials should always correlate with the US dollar such that if the dollar is Higher, then the bonds should follow and vice-versa. The S&P is Higher, and Crude is trading Higher which is not correlated. Gold is trading Lower which is not correlated with the US dollar trading Down. I tend to believe that Gold has an inverse relationship with the US Dollar as when the US Dollar is down, Gold tends to rise in value and vice-versa. Think of it as a seesaw, when one is up the other should be down. I point this out to you to make you aware that when we don't have a correlated market, it means something is wrong. As traders you need to be aware of this and proceed with your eyes wide open. At the present time all of Asia is trading Lower. Europe is also trading Lower as well.
Possible challenges to traders today
-
Challenger Job Cuts y/y is out at 7:30 AM EST. This is Major.
-
ADP Non-Farm Employment Change is out at 8:15 AM EST. This is Major.
-
Unemployment Claims are out at 8:30 AM EST. This is Major.
-
Revised Nonfarm Productivity q/q is out at 8:30 AM EST. This is not Major.
-
Revised Unit Labor Costs q/q is out at 8:30 AM EST. This is not Major.
-
Final Manufacturing PMI is out at 9:45 AM EST. This is Major.
-
ISM Manufacturing PMI is out at 10 AM EST. This is Major.
-
ISM Manufacturing Prices is out at 10 AM EST. This is Major.
-
Construction Spending m/m is out at 10 AM EST. This is Major.
-
Wards Total Vehicle Sales - All Day by Brand. Major.
-
Natural Gas Storage is out at 10:30 AM EST. This is Major.
-
Crude Oil Inventories are out at 11 AM EST. This is Major.
-
FOMC Member Harker Speaks at 1 PM EST. This is Major.
Treasuries
Traders, please note that we've changed the Bond instrument from the 30 year (ZB) to the 10 year (ZN). They work exactly the same.
We've elected to switch gears a bit and show correlation between the 10-year bond (ZN) and the S&P futures contract. The S&P contract is the Standard and Poor's, and the purpose is to show reverse correlation between the two instruments. Remember it's likened to a seesaw, when up goes up the other should go down and vice versa.
Yesterday the ZN migrated Higher at around 10:15 AM EST as the S&P hit a High at around the same time. If you look at the charts below the ZN gave a signal at around 10:15 AM and the ZN continued its Upward trend. Look at the charts below and you'll see a pattern for both assets. S&P hit a High at around 10:15 AM and migrated Lower. These charts represent the newest version of MultiCharts and I've changed the timeframe to a 15-minute chart to display better. This represented a Long opportunity on the 10-year note, as a trader you could have netted about 20 plus ticks per contract on this trade. Each tick is worth $15.625. Please note: the front month for the ZN is now Jun '23. The S&P contract is also Jun' 23. I've changed the format to filled Candlesticks (not hollow) such that it may be more apparent and visible.
Charts courtesy of MultiCharts built on an AMP platform
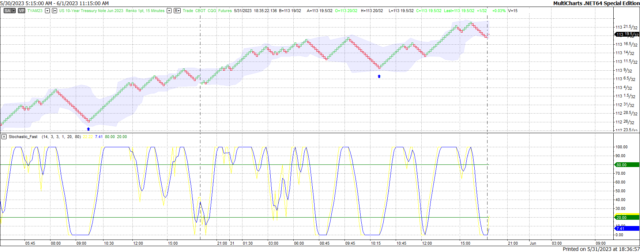
ZN - Jun 2023 - 5/31/23
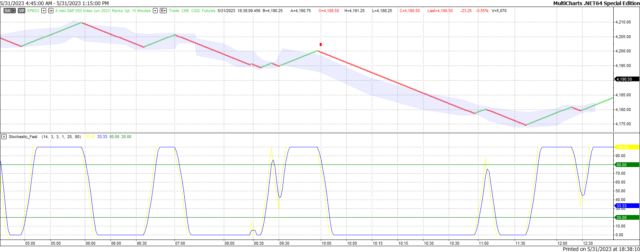
S&P - Jun 2023 - 5/31/23
Bias
Yesterday we gave the markets a Downside bias as both the USD and Crude were trading Higher Wednesday morning and that usually reflects a Downside Day. The indices didn't disappoint as the Dow closed 135 points Lower and the other indices lost ground as well. Today we aren't dealing with a correlated market and our bias is to the Upside.
Could this change? Of Course. Remember anything can happen in a volatile market.
Commentary
The folks in DC are still duking it out on the Debt Ceiling compromise and some factions of both parties aren't happy with the agreement. Some of the extreme Right are intent on default and some folks on the Left aren't keen on the work requirements for the Food Stamp program. The good news here is it doesn't appear as though Medicare and Social Security are being touched which is good news for seniors. After all they only spent their entire working lives paying into the system. This compromise will be voted on Wednesday evening so come Thursday we may have a positive surprise. Mind you that if it passes the House, it must still go to the Senate before it hits Joe Biden's desk. As an Update to this, the House has passed the Debt Ceiling accord which will now be sent to the Senate for approval.
Author

Nick Mastrandrea
Market Tea Leaves


