USD/JPY – Yen volatility takes pause

The Japanese yen has settled down at the start of the new trading week. Currently, USD/JPY is trading at 104.66, up 0.10% on the day.
The yen has shown significant volatility of late. The currency declined 1.17% last week, erasing almost all of the gains made in the previous week. It should be kept in mind that the gains and losses we’re seeing from the yen are more a case of US dollar movement, rather than yen-specific volatility. Around the US election, investors engaged in a massive selloff of US dollars, as the market buy-all frenzy lifted the G-10 currencies, including the safe-haven Japanese yen. However, the US dollar was in recovery mode last week and recovered these losses against the yen.
Japan GDP beats forecast
Major economies have shown a strong recovery in the third quarter, after sustaining a sharp GDP decline in Q2. Japan’s second-quarter decline of -7.8% was more moderate than many other major economies, which showed contraction in double digits. The Q3 reading came in at 5.0%, which was lower than the Q2 decline but still beat the forecast of 4.4%. There was more good news, as Industrial Production accelerated to 3.9% in September, up strongly from 1.0% beforehand.
On Thursday, Japan releases National Core CPI, an important inflation gauge. The index has not posted a gain since February, reflective of weak economic conditions due to the Covid-19 pandemic. The Japanese yen may have jumped on the bandwagon around the US election and posted sharp gains, but the upswing was shortlived, as the Japanese economy continues to limp along. The yen’s major selling point for investors is its safe-haven status, but investors have shown a surprising tolerance for risk despite Covid, so it could be a bumpy road ahead for the Japanese currency.
USD/JPY Technical Analysis
-
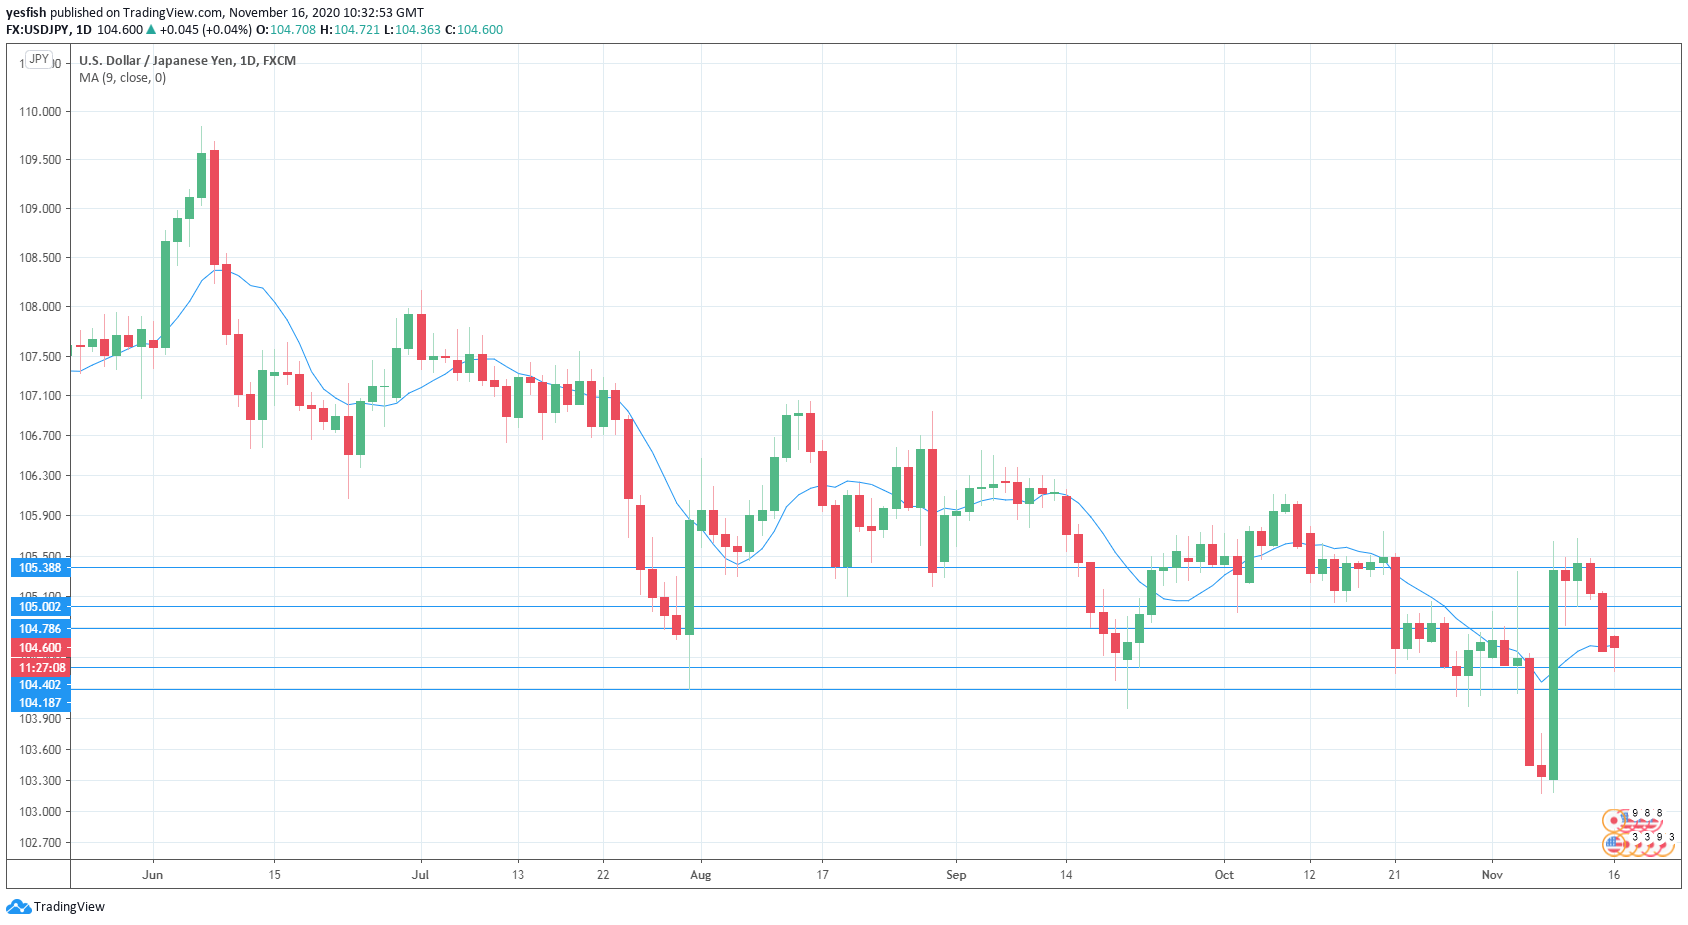
104.78 is a weak resistance line. This is followed by resistance lines at 105.00 and 105.38.
-
104.40 is the first line of support. Below, there is support at 104.18.
-
USD/JPY is testing the 20-day MA line. A move below this line would be a sign of a downturn for the pair.
Author

Kenny Fisher
MarketPulse
A highly experienced financial market analyst with a focus on fundamental analysis, Kenneth Fisher’s daily commentary covers a broad range of markets including forex, equities and commodities.


