|

USD/JPY: Trade weight index vs spot USD/JPY, interest rates

Green = Interest Rates.

Red = Nominal Spot Rate.

Blue = Effective Trade Weight Index.

Chart

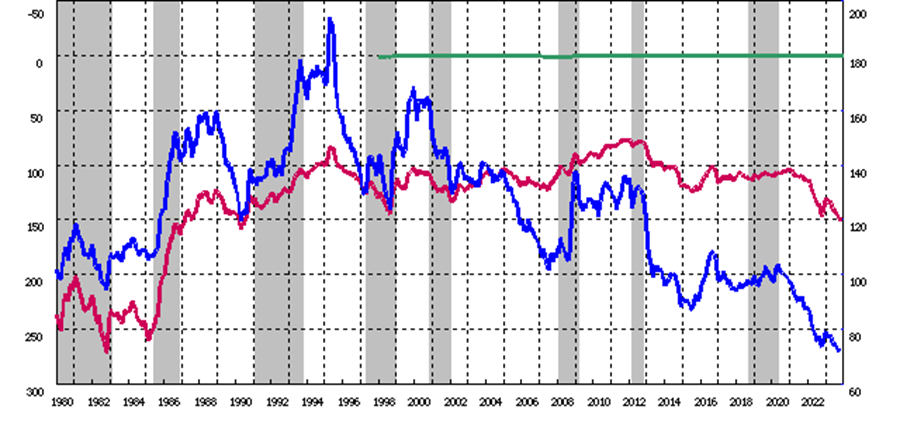
The period runs from 1980 to 2023. The spot rate trading above the Effective Trade Weight Index is correct in any trade year or period because the Effective Trade Weight Index is factored to Oil and GDP for monthly releases to Imports and Exports.

The Green interest rate line represents pre 2016 negative rates.

USD/JPY Vs Effective Exchange Rate Index for June to represent the period from 1996 to 2023.

Blue = Nominal Spot Rate.

Orange = Effective Trade Weight Index.

Overall, fairly big move from June to December was seen early.

Chart

BOJ interest rates

BOJ Interest Rates dropped in 2008 /2009 then traveled to negative in 2016. From 2016, interest rates failed to move.

The period covers 1990 to 2023. As 2024 approaches and promises to central bank drops to interest rates, the BOJ will remain on hold and not move interest rates by 1 point. 

Chart

Author

Brian Twomey

Brian Twomey

Brian's Investment

Brian Twomey is an independent trader and a prolific writer on trading, having authored over sixty articles in Technical Analysis of Stocks & Commodities and Investopedia.

More from Brian Twomey
Share:

Editor's Picks

EUR/USD flat lines around 1.1900; looks to US NFP report for fresh directional impetus

The EUR/USD pair is seen oscillating in a narrow trading band around the 1.1900 mark during the Asian session on Wednesday as traders opt to wait for the release of US monthly employment details before placing fresh directional bets.

GBP/USD slips back to daily lows near 1.3640

GBP/USD drops to daily lows near 1.3640 as sellers push harder and the Greenback extends its rebound in the latter part of Tuesday’s session. Looking ahead, the combination of key US releases, including NFP and CPI, alongside important UK data, should keep the pound firmly in focus over the coming days.

Gold awaits US Nonfarm Payrolls data for a sustained upside

Gold remains capped below $5,100 early Wednesday, gathering pace for the US labor data. The US Dollar licks its wounds amid persistent Japanese Yen strength and potential downside risks to the US jobs report. Gold holds above $5,000 amid bullish daily RSI, with eyes on 61.8% Fibo resistance at $5,141.

Ethereum: Whales buy the dip amid rising short bets

Following one of Ethereum's largest weekly drawdowns, whales are slowly returning to action alongside a drop in retail selling pressure. After slightly selling into the decline at the start of the month, whales or wallets with a balance of 10K-100K ETH began buying the dip last Wednesday as prices crashed further. 

Dollar drops and stocks rally: The week of reckoning for US economic data

Following a sizeable move lower in US technology Stocks last week, we have witnessed a meaningful recovery unfold. The USD Index is in a concerning position; the monthly price continues to hold the south channel support.

XRP holds $1.40 amid ETF inflows and stable derivatives market

Ripple trades under pressure, with immediate support at $1.40 holding at the time of writing on Tuesday. A recovery attempt from last week’s sell-off to $1.12 stalled at $1.54 on Friday, leading to limited price action between the current support and the resistance.