USD/JPY Forecast: Retains weak tone despite strong US data, sub-110.00 looks likely

Friday brought good news for the US dollar, but the greenback is not impressed.
US core inflation, which excludes food and energy prices, increased 0.3 percent in December. Analysts at Wells Fargo write, "core inflation, which is up 1.8 percent on a year-ago basis, has risen at a 2.5 percent pace over the past three months. This should help to allay some FOMC members’ fears that inflation is stuck at undesirably low levels."
Meanwhile, the headline inflation increased 0.1 percent following a 0.4 percent rise in November. Wells Fargo Analysts blame the drop in energy prices for the pullback in the headline number.
Also published was the US retail sales figure, which showed domestic demand strengthened in December. The retail-control group sales, which are used to calculate GDP and exclude food services, auto dealers, building materials stores and gasoline stations, rose 0.3% in December following an upwardly revised 1.4% advance, which as per Bloomberg report was the largest since 2005.
Both data releases (core inflation and retail sales) are probably strong enough to keep Fed on track to raise interest rates in March.
Further, the stock markets remain well bid at record highs. Oil rally is showing no signs of slowing down. Also, Republican-controlled US Congress approved$1.5 trillion tax cut package last month. All this could force the Fed to quicken the pace of policy tightening.
Even the 10-year treasury yield is set to close the week above 2.5 percent for the first time since mid-March 2017.
Still, the USD/JPY pair faded the spike to 111.70 and fell back to 111.00 levels. The price action only adds credence to the bearish technical outlook (drop to 110.00 likely).
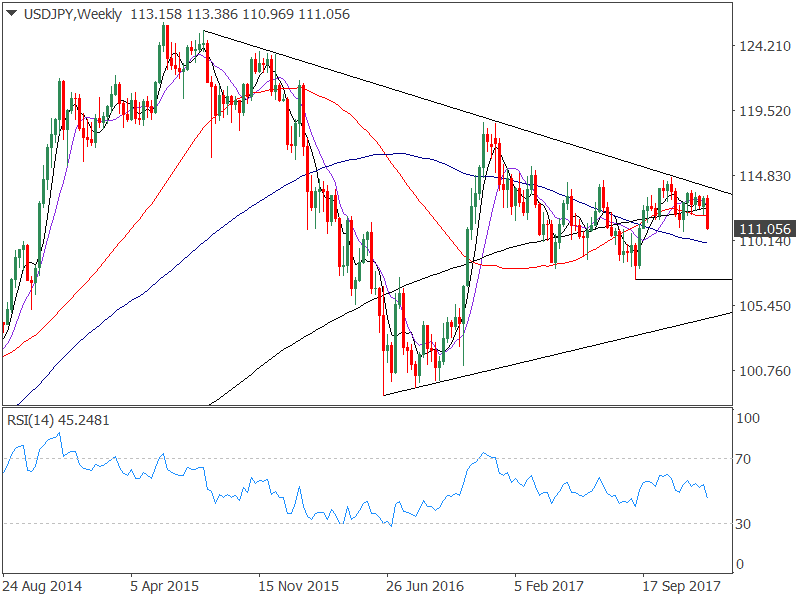
- As seen on the above chart, the repeated exhaustion near the long-term descending trendline support has finally translated into a big move lower.
- The RSI has turned bearish as well (below 50.00).
Weekly chart - Bullish crab pattern
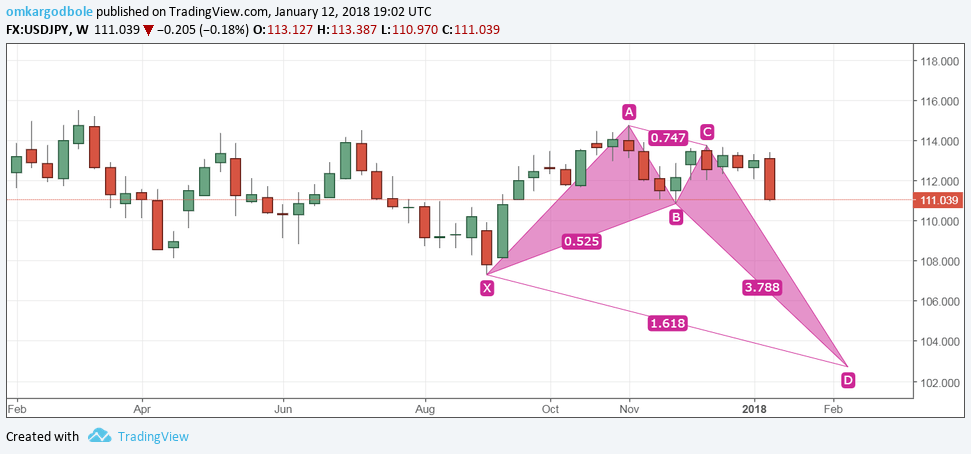
- The above chart shows the pair has formed a bullish bat pattern over the four month period - September to January.
- Interestingly, the failure at the long-term descending trend line hurdle marks the beginning of the last leg (CD - 161.8% extension of XA) of the bullish bat.
- As per bullish bat pattern rules, point D (102.73) is the bullish reversal point.
View
- So, a drop to 110.00 (Weekly 100-MA + psychological level) looks likely. The losses could be extended further to 108.13 (April low) and 107.32 (September low).
- The bullish crab pattern shows scope for a decline to 102.73. However, the rule is not set in stone and a reversal can happen well ahead of 102.73.
Author

Omkar Godbole
FXStreet Contributor
Omkar Godbole, editor and analyst, joined FXStreet after four years as a research analyst at several Indian brokerage companies.


