USD/JPY Forecast: Rally to 125.00 likely given the strong correlation with 10-year T-yield

The rally in the USD/JPY pair from the low of 107.32 ran out of steam last week at a high of 112.72. Currently, the spot is trading around 111.60. Despite the pullback from the high of 112.72, the short-term outlook remains bullish as-
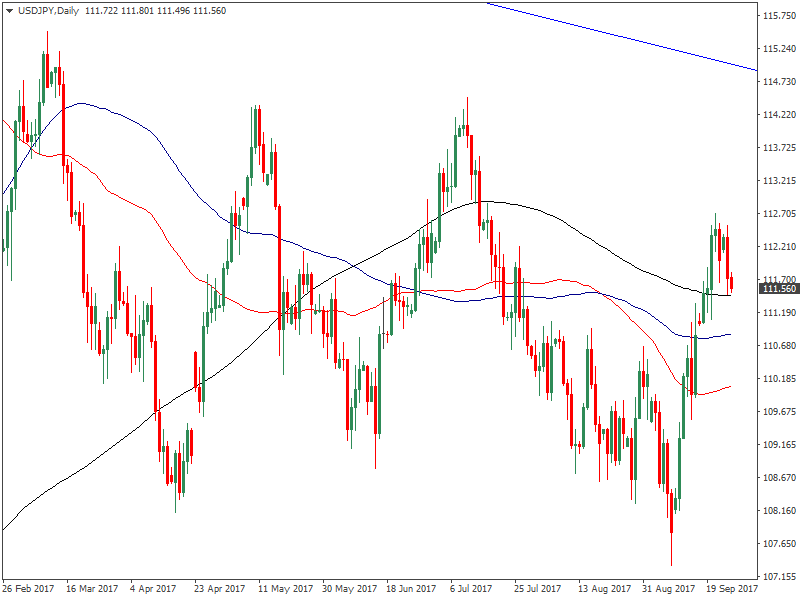
USD/JPY Daily chart
- The Dollar Index is showing signs of life
- Markets continue to brush aside North Korea risks
- Markets have yet to price-in Fed's reverse QE [treasury yields could rise]
- The 5-DMA & 10-DMA are sloping upwards
- The 14-day RSI remains above 50.00
- The 50-MA, the 100-MA and the 200-MA are sloping upwards on the 4-hour chart
- Golden cross - 50-MA & 200-MA bullish crossover is close to being confirmed on the weekly chart
Dips below the upward sloping 10-DMA (currently at 111.46) are likely to be met with fresh bids. A break above 112.72 would mark the continuation of the rally from the low of 107.32 and would open up upside towards 115.00.
USD/JPY Eyes 125.00
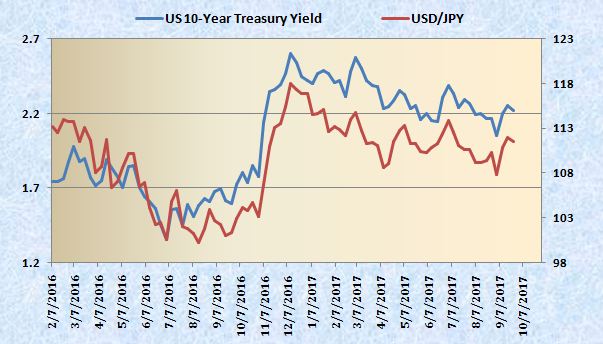
The weekly Pearson Product-Moment Correlation Coefficient value for the US 10-year yield and the USD/JPY pair is 0.82. The reading indicates a strong positive correlation between the two.
US 10-year yield weekly chart
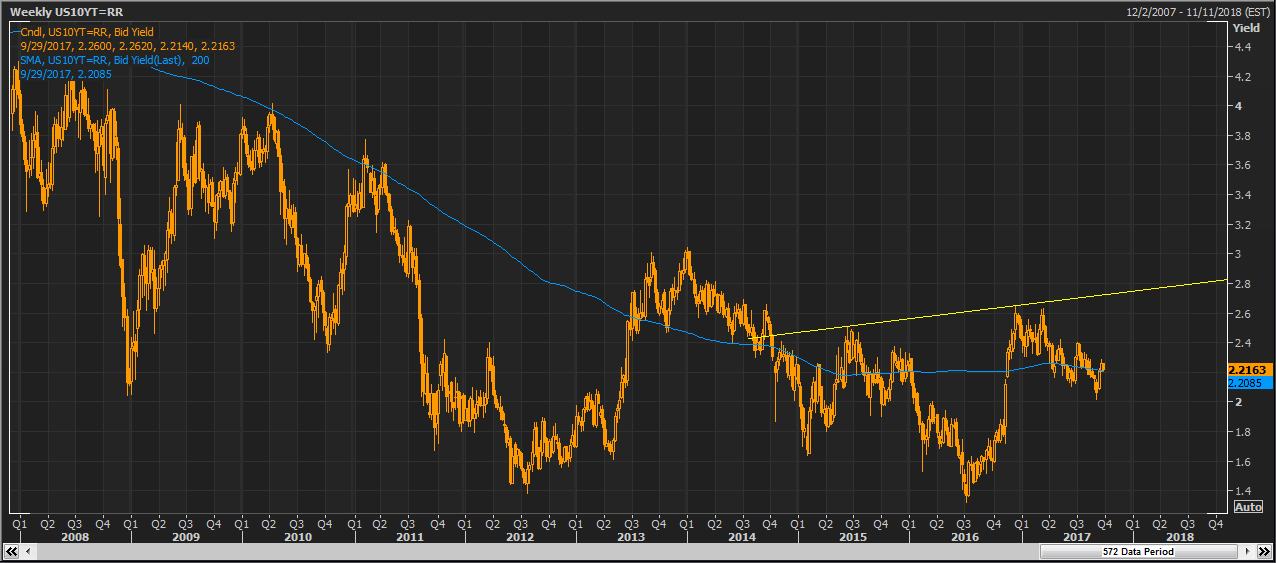
A big inverse head and shoulders formation with the neckline level around 2.7% is seen. A break higher would open doors for 4.08% [target as per measured height method].
Will the 10-year yield see a bullish inverse head and shoulders reversal?
The odds high as-
- Bond bubble burst is more likely
- The 10-year yield could rise at a faster rate once the Fed starts offloading the long duration bonds. Moreover, it could lead to a steeper yield curve
- Oil rally and consecutive better-than-expected monthly China PPI reading could lift 5-year, 5year forward inflation expectations and the 10-year treasury yield
Given the strong positive correlation between the 10-year yield and the USD/JPY pair, a rally in the 10-year treasury yield from the current level of 2.20% to 2.7% could easily yield 125.00 levels in the USD/JPY pair.
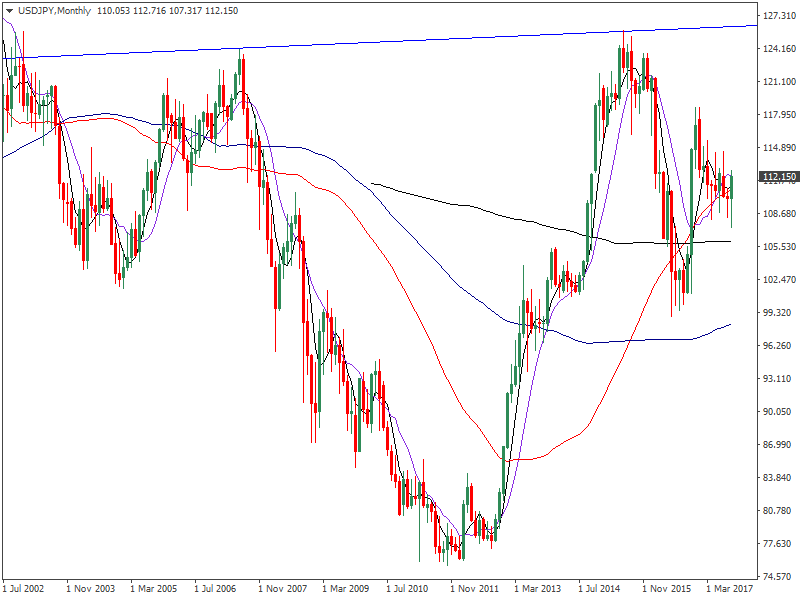
What's more interesting is the fact that the monthly chart of the USD/JPY pair shows a big inverse head and shoulder pattern with a neckline at 126.00 levels.
Author

Omkar Godbole
FXStreet Contributor
Omkar Godbole, editor and analyst, joined FXStreet after four years as a research analyst at several Indian brokerage companies.


