USD/JPY Elliott Wave technical analysis [Video]
![USD/JPY Elliott Wave technical analysis [Video]](https://editorial.fxsstatic.com/images/i/USDJPY-bearish-line_XtraLarge.png)
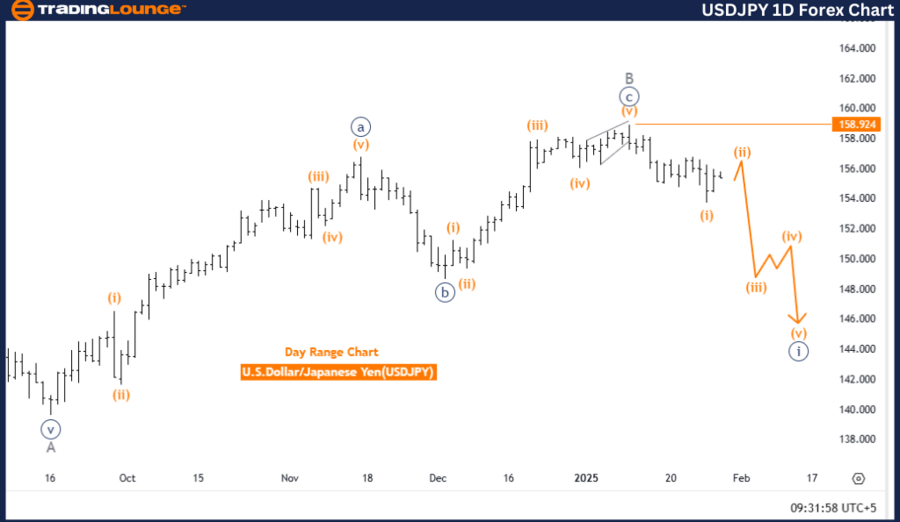
U.S. Dollar/Japanese Yen (USDJPY) Day Chart.
USD/JPY Elliott Wave technical analysis
-
Function: Bearish Trend.
-
Mode: Impulsive.
-
Structure: Navy Blue Wave 1.
-
Direction next lower degrees: Navy Blue Wave 1 (Started).
-
Details: Navy Blue Wave 1 has initiated a new downtrend.
-
Wave cancel invalidation level: 158.924.
Analysis overview:
This analysis examines the USDJPY currency pair using Elliott Wave Theory on a daily chart, identifying a bearish trend in an impulsive mode. The primary wave under observation is Navy Blue Wave 1, which has recently started, marking the beginning of a new downward movement.
The development of Navy Blue Wave 1 suggests the market has entered an impulsive phase, driven by strong bearish momentum. This wave is part of a larger structure, indicating the potential for further downside movement as the trend progresses. Traders should monitor this phase closely, as it represents the early stages of a broader bearish cycle.
Key considerations:
-
The invalidation level for this wave count is set at 158.924.
-
A rise above this threshold would invalidate the current wave structure, requiring a reassessment of the market outlook.
-
The impulsive nature of Navy Blue Wave 1 signals a sustained bearish trend, emphasizing strong downward pressure in the market.
Conclusion:
The daily chart analysis for USDJPY indicates the beginning of a bearish trend, triggered by the initiation of Navy Blue Wave 1. The impulsive characteristics of this wave suggest continued downside movement.
The invalidation level at 158.924 acts as a key risk management point, ensuring traders have a clear threshold for confirming or rejecting the wave count.
This Elliott Wave analysis provides valuable insights, helping traders align their strategies with the emerging bearish trend while remaining vigilant for potential market reversals.
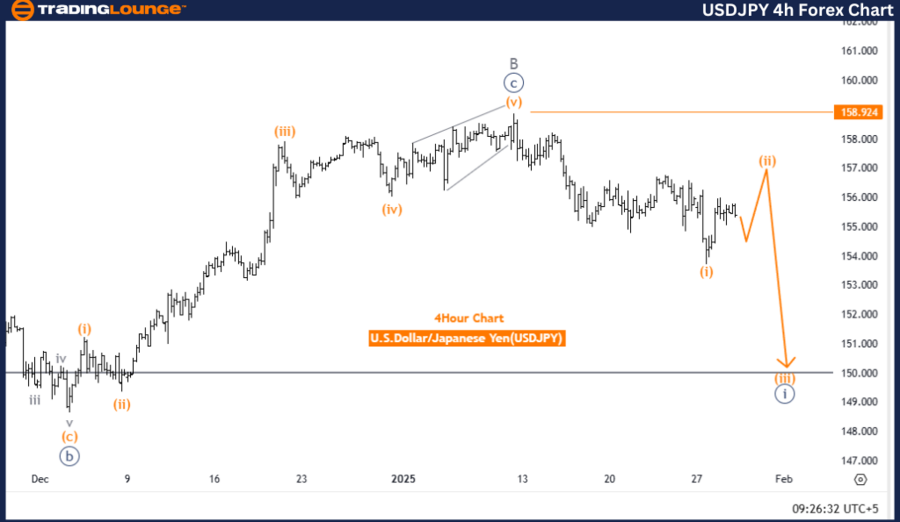
U.S. Dollar/Japanese Yen (USDJPY) 4-Hour Chart.
USD/JPY Elliott Wave technical analysis
-
Function: Counter Trend.
-
Mode: Corrective.
-
Structure: Orange Wave 2.
-
Position: Navy Blue Wave 1.
-
Direction next lower degrees: Orange Wave 3.
-
Details: Orange Wave 1 of Navy Blue Wave 1 appears completed, with Orange Wave 2 currently in play.
-
Wave cancel invalidation level: 158.924.
Analysis overview:
This analysis examines the USDJPY currency pair using Elliott Wave Theory on a 4-hour chart, highlighting a counter-trend movement in a corrective mode. The primary structure under observation is Orange Wave 2, which has commenced following the completion of Orange Wave 1 within Navy Blue Wave 1. This development signals a temporary market pullback.
At present, the pair is positioned in Navy Blue Wave 1, with Orange Wave 2 actively in play. This phase represents a corrective movement, allowing the market to consolidate the gains made during Orange Wave 1.
Once Orange Wave 2 concludes, the emergence of Orange Wave 3 is expected, potentially signaling a return to upward momentum.
Key considerations:
-
The invalidation level for this wave count is set at 158.924.
-
A decline below this threshold would invalidate the current wave structure, requiring a reassessment of the market outlook.
-
The anticipated emergence of Orange Wave 3 suggests a potential shift back to bullish momentum after this temporary corrective phase.
Conclusion:
The 4-hour chart analysis for USDJPY highlights a counter-trend corrective phase, driven by the formation of Orange Wave 2 within Navy Blue Wave 1. The completion of Orange Wave 1 signals the beginning of this temporary pullback, with Orange Wave 3 expected to follow.
The invalidation level at 158.924 provides a key risk management reference, helping traders confirm or invalidate the current wave count.
This Elliott Wave analysis delivers structured insights into the ongoing corrective movement, equipping traders with the necessary guidance to navigate the market and prepare for potential future shifts within the Elliott Wave framework.
Technical analyst: Malik Awais.
USD/JPY Elliott Wave technical analysis [Video]
Author

Peter Mathers
TradingLounge
Peter Mathers started actively trading in 1982. He began his career at Hoei and Shoin, a Japanese futures trading company.


