USD/JPY Elliott Wave technical analysis [Video]
![USD/JPY Elliott Wave technical analysis [Video]](https://editorial.fxsstatic.com/images/i/USDJPY-bearish-line_XtraLarge.png)
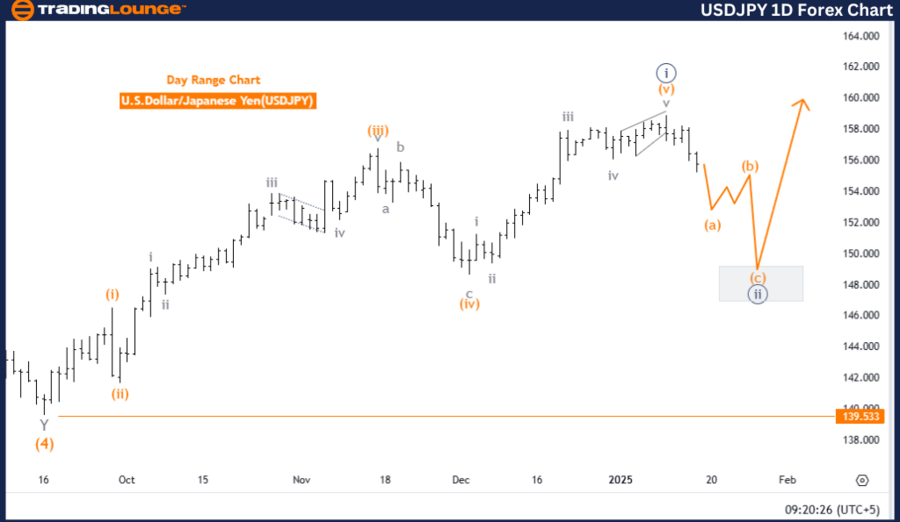
U.S. Dollar / Japanese Yen (USDJPY) Day Chart
USD/JPY Elliott Wave technical analysis
-
Function: Counter Trend.
-
Mode: Corrective.
-
Structure: Navy Blue Wave 2.
-
Position: Gray Wave 1.
-
Direction next higher degrees: Navy Blue Wave 3.
-
Details: Navy blue wave 1 appears completed; navy blue wave 2 is unfolding.
-
Wave cancel invalidation level: 139.533.
The USDJPY pair is currently exhibiting a counter-trend movement, as shown by the Elliott Wave Analysis on the daily chart. The market is undergoing a corrective phase within the structure of navy blue wave 2, representing a temporary retracement before the broader bullish trend resumes.
The navy blue wave 1 seems to have concluded, marking the end of the prior impulsive movement. At present, the market is advancing through navy blue wave 2, which is defined by corrective price action. This phase serves as a preparatory stage for the anticipated navy blue wave 3, expected to drive the market back into the overall upward trend.
An important aspect of this analysis is the invalidation level set at 139.533. If the price falls below this level, the current wave scenario would be invalidated, necessitating a reevaluation of the wave structure. This invalidation point acts as a critical benchmark for ensuring the integrity of the Elliott Wave principles and monitoring the progression of the corrective phase.
Summary
-
The USDJPY is currently in navy blue wave 2, undergoing a corrective phase after the completion of navy blue wave 1.
-
The corrective movement sets the stage for the anticipated navy blue wave 3, which is expected to resume the larger bullish trend.
-
The invalidation level of 139.533 serves as a key reference point to confirm or reassess the wave analysis.
-
The focus remains on the completion of this corrective phase and the transition into the next impulsive movement within the larger wave cycle.
USD/JPY Elliott Wave technical analysis
-
Function: Counter Trend.
-
Mode: Impulsive.
-
Structure: Orange Wave A.
-
Position: Navy Blue Wave 2.
-
Direction next higher degrees: Orange Wave B.
-
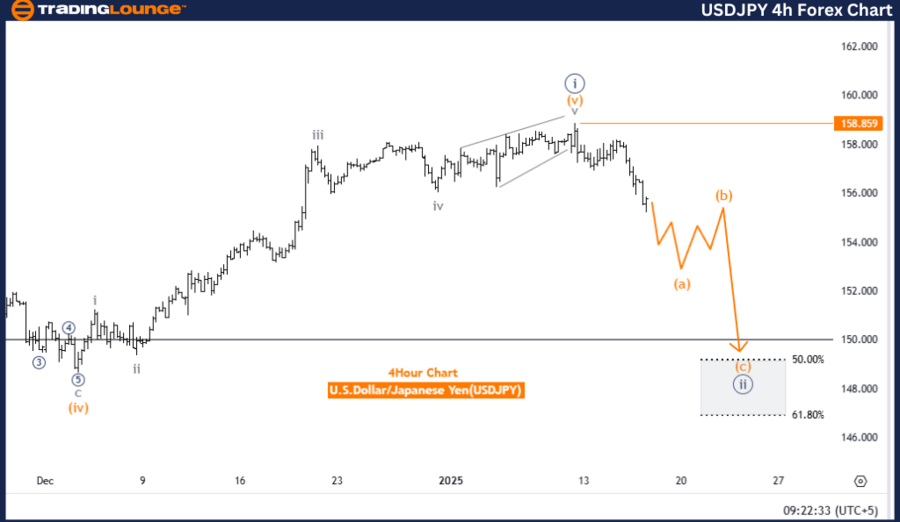
Details: Navy blue wave 1 appears completed; orange wave A of 2 is currently unfolding.
-
Wave cancel invalidation level: 158.859.
The USDJPY is presently in a counter-trend phase, as indicated by Elliott Wave Analysis on the 4-hour chart. The market is demonstrating impulsive behavior, represented by orange wave A, which is part of the broader navy blue wave 2 corrective structure. This phase reflects a temporary pullback within the ongoing bullish trend.
The navy blue wave 1 appears to have concluded, and the market is now progressing through orange wave A of navy blue wave 2. This wave represents the first segment of the correction, preceding the development of orange wave B, the subsequent phase in the corrective pattern.
A critical invalidation level has been identified at 158.859. If the price surpasses this level, the current wave analysis would be invalidated, requiring a reassessment of the wave structure. This invalidation point is a key benchmark for ensuring the integrity of the ongoing wave analysis within the Elliott Wave framework.
Summary
-
The USDJPY is currently in orange wave A of navy blue wave 2, reflecting the initial leg of the corrective phase.
-
The completion of navy blue wave 1 marks the beginning of the broader corrective structure, with orange wave B expected to follow.
-
The invalidation level at 158.859 serves as a key reference for confirming or adjusting the wave analysis.
-
The focus remains on the progression and conclusion of orange wave A and the transition into the next phase of the corrective cycle.
USD/JPY Elliott Wave technical analysis [Video]
Author

Peter Mathers
TradingLounge
Peter Mathers started actively trading in 1982. He began his career at Hoei and Shoin, a Japanese futures trading company.


