USD/JPY Elliott Wave technical analysis [Video]
![USD/JPY Elliott Wave technical analysis [Video]](https://editorial.fxstreet.com/images/Markets/Currencies/Majors/USDJPY/yen-japones-billetes-de-banco_XtraLarge.jpg)
USDJPY Elliott Wave Analysis Trading Lounge
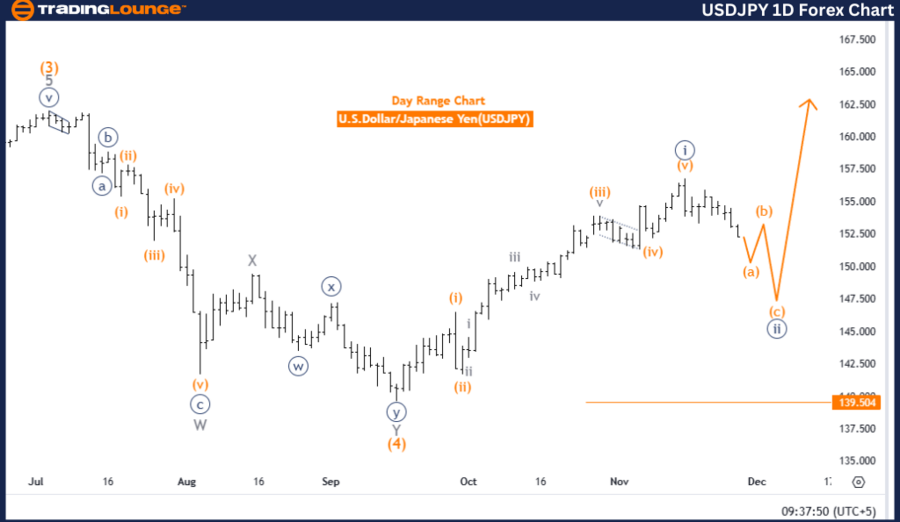
U.S. Dollar / Japanese Yen (USDJPY) – Day Chart
USD/JPY Elliott Wave technical analysis
-
Function: Counter Trend.
-
Mode: Corrective.
-
Structure: Navy Blue Wave 2.
-
Position: Gray Wave 1.
-
Direction (next higher degree): Navy Blue Wave 3.
-
Details: Navy blue wave 1 appears to be completed, and navy blue wave 2 is now active.
-
Wave cancel invalidation level: 139.504.
Analysis summary: This analysis focuses on the USD/JPY currency pair through the lens of Elliott Wave theory on a daily chart. The current phase reflects a counter-trend movement, characterized as a corrective mode within the broader market trend.
Key observations
-
Primary structure: The analysis centers on navy blue wave 2, which began after the completion of navy blue wave 1. This phase signals the continuation of the broader corrective cycle.
-
Current position: Within navy blue wave 2, the market is presently forming gray wave 1. This represents an early stage of the corrective structure and suggests further development before shifting into navy blue wave 3, which marks the next impulsive upward trend.
-
Invalidation level: The price level of 139.504 serves as the critical point for confirming or negating the current wave count. If the price falls to this level, the corrective outlook will be invalidated, prompting a reassessment of the wave structure.
Conclusion
The Elliott Wave analysis for USDJPY indicates the currency pair is navigating a counter-trend phase. Navy blue wave 2 is actively unfolding, following the completion of navy blue wave 1. Within this corrective phase, gray wave 1 is in progress, showcasing the initial stages of the wave structure.
The counter-trend analysis remains valid as long as the price stays above the invalidation level of 139.504. Continued corrective action is expected before transitioning into the impulsive phase represented by navy blue wave 3.
USD/JPY Elliott Wave technical analysis
-
Function: Counter Trend.
-
Mode: Corrective.
-
Structure: Orange Wave A.
-
Position: Navy Blue Wave 2.
-
Direction (next higher degree): Orange Wave B.
-
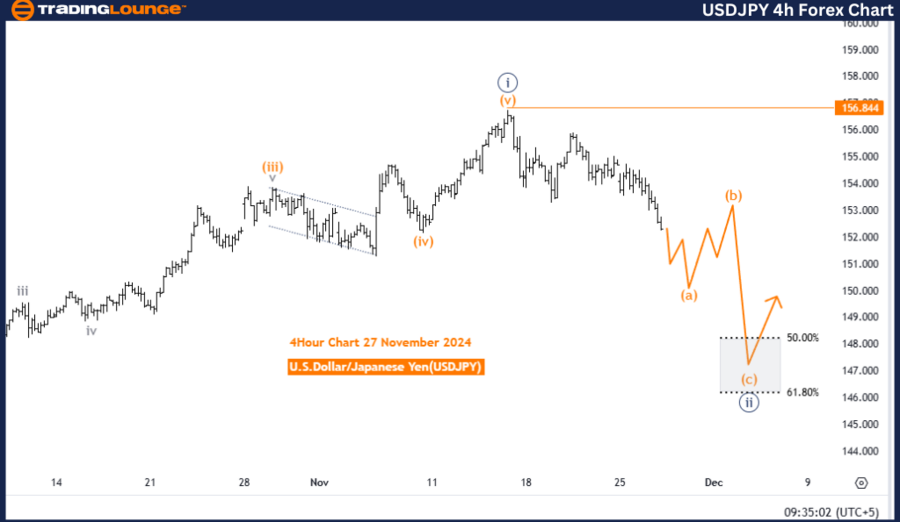
Details: Navy blue wave 1 appears to have completed, and orange wave A of navy blue wave 2 is currently active.
-
Wave cancel invalidation level: 156.844.
Analysis summary: This analysis evaluates the USD/JPY currency pair using Elliott Wave theory on a 4-hour chart. The current market phase is identified as a counter-trend movement, indicating a corrective mode within the broader trend.
Key observations
-
Primary structure:
- The analysis focuses on navy blue wave 2, which commenced after the completion of navy blue wave 1.
- Within this structure, orange wave A represents the first leg of the correction.
-
Current position:
- The market is currently unfolding orange wave A within navy blue wave 2.
- This phase marks the initial progression of the corrective wave, with further development expected before completing navy blue wave 2.
-
Next phase:
- Following orange wave A, the higher-degree corrective structure will transition to orange wave B.
- This shift will complete the broader navy blue wave 2 correction.
-
Invalidation level:
- A key invalidation level is set at 156.844. If the price reaches or exceeds this level, the current wave count and corrective outlook will no longer hold, requiring a revised analysis.
Conclusion
The Elliott Wave analysis for USDJPY indicates a counter-trend corrective phase is underway. Orange wave A, as part of navy blue wave 2, is actively progressing. The completion of navy blue wave 1 confirms the beginning of this corrective structure.
The counter-trend outlook remains intact as long as the price stays below the invalidation level of 156.844. Continued corrective movement within orange wave A is anticipated before transitioning to orange wave B, ultimately completing navy blue wave 2.
USD/JPY Elliott Wave technical analysis [Video]
Author

Peter Mathers
TradingLounge
Peter Mathers started actively trading in 1982. He began his career at Hoei and Shoin, a Japanese futures trading company.


