USD/JPY Elliott Wave technical analysis [Video]
![USD/JPY Elliott Wave technical analysis [Video]](https://editorial.fxstreet.com/images/Markets/Currencies/Majors/USDJPY/japanese-yen-currency-and-dollar-bank-note-60447532_XtraLarge.jpg)
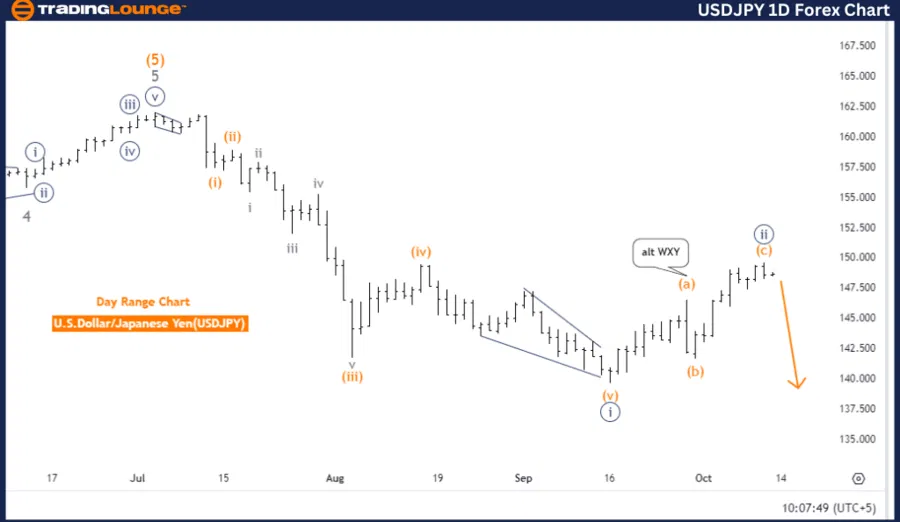
U.S. Dollar / Japanese Yen (USDJPY) day chart
USD/JPY Elliott Wave technical analysis
Function: Bearish Trend.
Mode: Impulsive.
Structure: Navy Blue Wave 3.
Position: Gray Wave 1.
Next lower degree direction: Navy Blue Wave 3 (In Progress).
Details: Navy Blue Wave 2 appears completed, and now Navy Blue Wave 3 is underway.
Analysis summary
The Elliott Wave analysis of USDJPY on the daily chart indicates a bearish trend in an impulsive mode. The current structure highlights that Navy Blue Wave 3 is in motion, with the position set in Gray Wave 1, signaling the early phase of a downward trajectory. The prior Navy Blue Wave 2 appears to have concluded, marking the beginning of the impulsive Navy Blue Wave 3, suggesting further bearish momentum.
In terms of the next lower degree, the market's direction is clearly aligned with the continuation of Navy Blue Wave 3, which has already begun. This reinforces the idea that the bearish trend is likely to persist, with continued downward pressure. With the corrective phase of Navy Blue Wave 2 complete, the market is now focused on the stronger, impulsive decline.
Market outlook
The market is in the early stages of a bearish wave sequence, and as Navy Blue Wave 3 unfolds, additional declines are anticipated. Given the impulsive nature of the current movement, the downtrend is expected to strengthen, limiting any potential upside in the short term as selling pressure dominates.
Conclusion
The USDJPY is entrenched in a bearish trend on the daily chart, driven by the progression of Navy Blue Wave 3, which follows the completed Navy Blue Wave 2. The impulsive wave structure suggests that the market’s downward momentum will continue, with Gray Wave 1 leading the ongoing decline. Overall, further declines are expected as Navy Blue Wave 3 continues to unfold, keeping the outlook bearish.
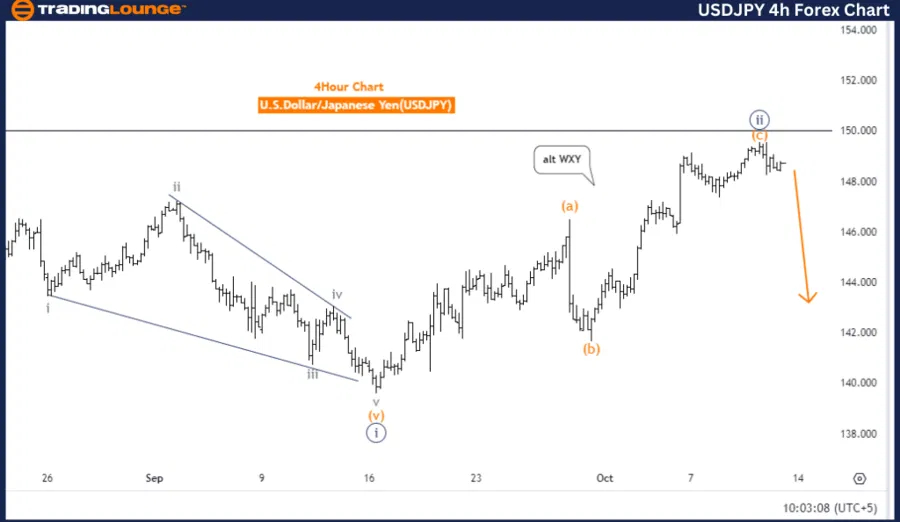
US Dollar/Japanese Yen (USDJPY) four-hour chart
USD/JPY Elliott Wave technical analysis
Function: Bearish Trend.
Mode: Impulsive.
Structure: Navy Blue Wave 3.
Position: Gray Wave 1.
Next lower degree direction: Navy Blue Wave 3 (In Progress).
Details: Navy Blue Wave 2 appears completed; now Navy Blue Wave 3 is unfolding.
Analysis summary
The USDJPY Elliott Wave analysis on the 4-hour chart reveals a bearish trend within an impulsive mode. The market's structure indicates that Navy Blue Wave 3 is currently unfolding, with the position in Gray Wave 1, signaling the strengthening of the downward movement. The market is in the early stages of Navy Blue Wave 3, indicating that bearish momentum is gaining traction.
With Navy Blue Wave 2 seemingly completed, the corrective phase has ended, and the market has shifted into the impulsive phase of Navy Blue Wave 3. This phase typically brings a stronger downward move, highlighting the continuation of the bearish trend.
Market outlook
The direction in the next lower degrees confirms the continuation of Navy Blue Wave 3, which has already started. This signals further declines as the wave develops. The overall structure remains bearish, driven by the impulsive nature of Navy Blue Wave 3, which indicates that sellers are in control, and the market is likely to extend its descent.
Conclusion
In conclusion, USDJPY is entrenched in a bearish trend on the 4-hour chart, with Navy Blue Wave 3 progressing after the completion of Navy Blue Wave 2. The impulsive mode implies that the downward movement is expected to continue, as the market moves through Gray Wave 1 and deeper into the lower degrees of Navy Blue Wave 3. As long as the structure holds, the outlook remains bearish, favoring further declines.
USD/JPY Elliott Wave technical analysis [Video]
Author

Peter Mathers
TradingLounge
Peter Mathers started actively trading in 1982. He began his career at Hoei and Shoin, a Japanese futures trading company.


