USD/JPY Elliott Wave technical analysis [Video]
![USD/JPY Elliott Wave technical analysis [Video]](https://editorial.fxstreet.com/images/Markets/Currencies/Majors/USDJPY/japanese-currency-1-000-yen-bank-notes-60861026_XtraLarge.jpg)
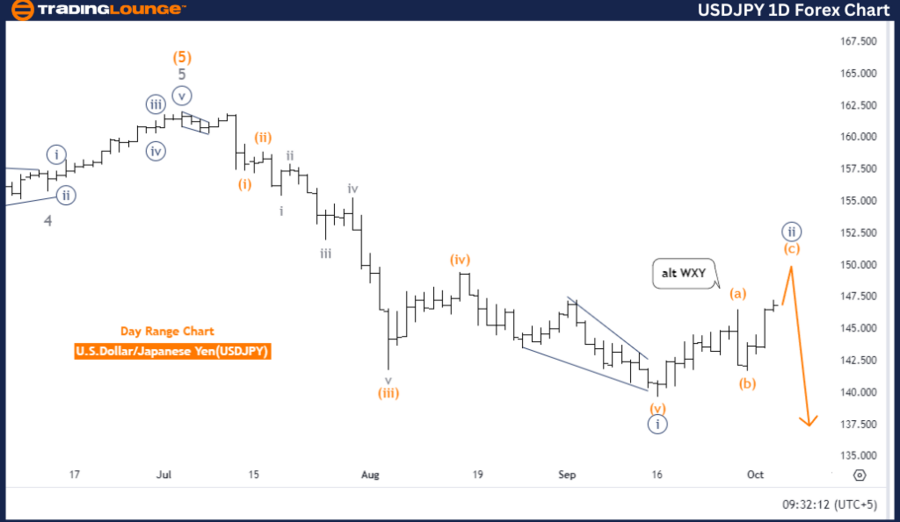
USDJPY Elliott Wave Analysis - Trading Lounge Day Chart.
U.S. Dollar / Japanese Yen (USDJPY) Day Chart.
USD/JPY Elliott Wave technical analysis
-
Function: Counter Trend.
-
Mode: Corrective.
-
Structure: Navy Blue Wave 2.
-
Position: Gray wave 1.
-
Direction next lower degrees: Navy blue wave 3.
-
Details: Navy Blue Wave 1 appears completed, with Navy Blue Wave 2 currently in progress.
-
Wave cancel invalid level: 161.963.
The USDJPY Elliott Wave Analysis for the daily chart indicates that the market is in a counter-trend phase, signifying a corrective movement against the main trend. This phase is characterized as corrective, implying that the current market behavior represents a temporary retracement rather than a continuation of the primary trend. The structure under analysis is Navy Blue Wave 2, following the completion of Navy Blue Wave 1.
At this point, the market is positioned in gray wave 1, while the corrective phase of navy blue wave 2 unfolds. Navy Blue Wave 1 has already concluded, and the market is now experiencing the retracement phase of Navy Blue Wave 2. According to Elliott Wave Theory, wave 2 typically retraces part of wave 1’s movement, signaling that the market is pulling back from the previous impulsive wave. This phase is expected to be temporary, with the market likely resuming its primary trend after the completion of Navy Blue Wave 2.
The next anticipated movement is navy blue wave 3, which generally follows the completion of wave 2. Wave 3 is often the most robust and extended wave in an Elliott Wave sequence, indicating a significant movement in the direction of the main trend once the correction phase concludes.
A critical level to observe is 161.963, the wave cancel invalidation point. If the market drops below this level, the current wave analysis will be rendered invalid, and a new evaluation of the structure will be necessary. This level is essential for determining whether the corrective phase remains intact.
Summary:
The USDJPY Elliott Wave Analysis points to the market being in a corrective phase, with navy blue wave 2 currently playing out. Traders should closely monitor the invalidation level of 161.963 to confirm the ongoing correction's validity. Once navy blue wave 2 concludes, navy blue wave 3 is expected to continue the primary trend with greater momentum.
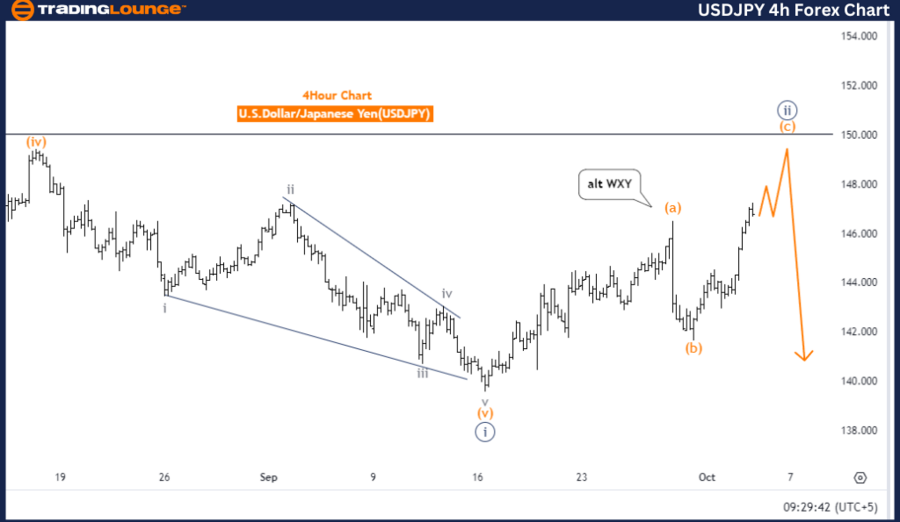
U.S. Dollar / Japanese Yen (USDJPY) 4 Hour Chart.
USD/JPY Elliott Wave technical analysis
-
Function: Counter Trend.
-
Mode: Corrective.
-
Structure: Navy Blue Wave 2.
-
Position: Gray wave 1.
-
Direction next lower degrees: Navy blue wave 3.
-
Details: Navy blue wave 1 seems completed, with navy blue wave 2 now unfolding.
-
Wave cancel invalid level: 161.963.
The USDJPY Elliott Wave Analysis for the 4-hour chart highlights a counter-trend movement, indicating that the market is in a correction phase. This phase is classified as corrective, signifying a temporary retracement against the main trend. The structure currently being examined is navy blue wave 2, following the completion of navy blue wave 1.
At this point, the market is positioned in gray wave 1, while navy blue wave 2 is developing. Navy blue wave 1 has already been completed, and the market is now in the retracement phase of navy blue wave 2. According to Elliott Wave Theory, wave 2 typically corrects some of the movement from wave 1, indicating that the market is temporarily retracing previous price action. This suggests that the current movement is temporary, and the primary trend is expected to resume after navy blue wave 2 completes.
The next anticipated phase is navy blue wave 3, which generally follows the corrective wave 2. Wave 3 is typically the strongest and most extended wave in an Elliott Wave sequence, signaling a return to the dominant trend with stronger momentum once the correction concludes.
A crucial level to observe is 161.963, which serves as the wave cancel invalidation point. If the market falls below this level, the current Elliott Wave analysis will be invalidated, and a reevaluation of the trend will be required. This level is essential in confirming whether the correction remains valid.
Summary:
The USDJPY Elliott Wave Analysis shows the market is in a corrective phase with navy blue wave 2 in progress. Traders should closely monitor the invalidation level of 161.963 to verify the correction's validity. Once navy blue wave 2 is complete, navy blue wave 3 is expected to resume the primary trend with stronger momentum.
Technical analyst: Malik Awais.
USD/JPY Elliott Wave technical analysis [Video]
Author

Peter Mathers
TradingLounge
Peter Mathers started actively trading in 1982. He began his career at Hoei and Shoin, a Japanese futures trading company.


