USD/JPY Elliott Wave technical analysis [Video]
![USD/JPY Elliott Wave technical analysis [Video]](https://editorial.fxstreet.com/images/Markets/Currencies/Majors/USDJPY/five-thousand-japanese-yen-notes-on-many-dollars-background-30615054_XtraLarge.jpg)
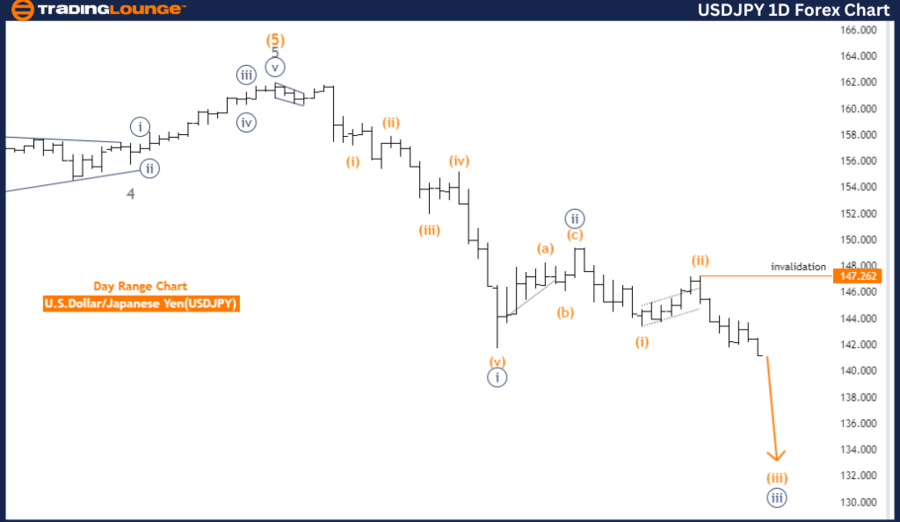
USDJPY Elliott Wave Analysis Trading Lounge Day Chart, U.S. Dollar / Japanese Yen (USDJPY) Day Chart.
USD/JPY Elliott Wave technical analysis
-
Function: Bearish Trend.
-
Mode: Impulsive.
-
Structure: Orange wave 3 (in progress).
-
Position: Navy Blue Wave 3.
-
Direction next higher degree: Orange wave 4.
Details:
The orange wave 2 appears to have completed, and now the orange wave 3 is unfolding. The wave invalidation level is 147.262.
The USDJPY Elliott Wave analysis on the day chart identifies a bearish trend. The technical analysis mode is impulsive, indicating strong downward momentum. The structure being analyzed is orange wave 3, which has started, signaling a strengthening downtrend.
Currently, the market is within navy blue wave 3, having progressed through earlier waves. Wave 3 is typically the most powerful and directional phase in an Elliott Wave pattern. The next higher-degree wave will likely be orange wave 4, which is expected to follow after wave 3 concludes. This points to a possible correction or consolidation once wave 3 finishes.
The previous orange wave 2 is completed, and now the focus is on orange wave 3. The wave invalidation level is set at 147.262; if the price reaches this level, the wave count would be considered invalid, requiring a re-evaluation of the market structure.
In summary, USDJPY is currently in a strong downward phase within an impulsive wave pattern, advancing through the third wave of the navy blue degree. The next important phase could be a corrective orange wave 4, but for now, attention remains on the unfolding orange wave 3, as long as the price does not exceed 147.262.
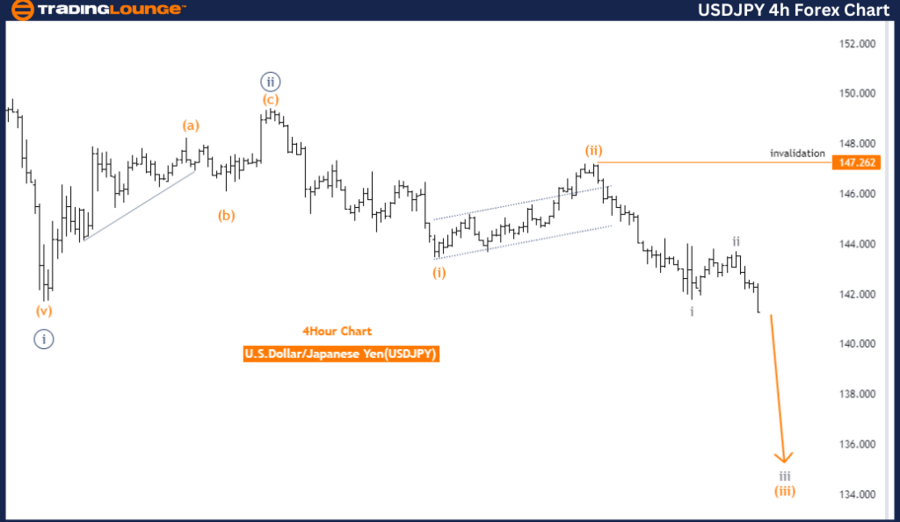
U.S. Dollar/Japanese Yen (USD/JPY) 4-Hour Chart.
USD/JPY Elliott Wave technical analysis
-
Function: Bearish Trend.
-
Mode: Impulsive.
-
Structure: Gray wave 3.
-
Position: Orange wave 3.
-
Direction next higher degree: Gray wave 4.
Details:
The gray wave 2 appears to have completed, and now gray wave 3 is underway. The wave invalidation level is 147.262.
The USDJPY Elliott Wave analysis on the 4-hour chart indicates a bearish trend. The analysis mode is impulsive, suggesting that the market is experiencing a strong downward movement. The structure currently tracked is gray wave 3, signaling the continuation of the bearish trend.
Currently, the market is positioned within orange wave 3, which is part of the larger gray wave 3. This wave is typically marked by sharp price movements, reinforcing the bearish outlook. With gray wave 2 completed, gray wave 3 has started, indicating that the downtrend has gained momentum, and further downward movement is expected.
The next higher-degree wave is gray wave 4, which will likely follow after the completion of gray wave 3. However, the focus remains on gray wave 3, as this is still driving market action. The downward momentum is expected to continue until the completion of wave 3, after which a potential corrective phase, gray wave 4, may emerge.
A critical invalidation level is set at 147.262. If the price surpasses this level, the current bearish Elliott Wave structure would be invalidated, possibly signaling a weakening bearish trend. However, as long as the price remains below this level, the market is expected to maintain its downward trajectory.
In conclusion, USDJPY is in a bearish trend, with gray wave 3 actively in progress. The completion of gray wave 2 suggests that the downward momentum is likely to continue, with the next significant phase being gray wave 4. The trend remains intact as long as the price stays below the invalidation level of 147.262.
Technical analyst: Malik Awais.
USD/JPY Elliott Wave technical analysis [Video]
Author

Peter Mathers
TradingLounge
Peter Mathers started actively trading in 1982. He began his career at Hoei and Shoin, a Japanese futures trading company.


