USD/JPY Elliott Wave technical analysis [Video]
![USD/JPY Elliott Wave technical analysis [Video]](https://editorial.fxstreet.com/images/Markets/Currencies/Majors/USDJPY/japanese-yens-7972406_XtraLarge.jpg)
USD/JPY Elliott Wave technical analysis
-
Function: Counter Trend.
-
Mode: Corrective.
-
Structure: Navy blue wave 2.
-
Direction next lower degrees: Navy blue wave 3.
-
Details: Navy blue wave 1 appears complete, with navy blue wave 2 currently in progress.
-
Wave cancel invalid level: 161.893.
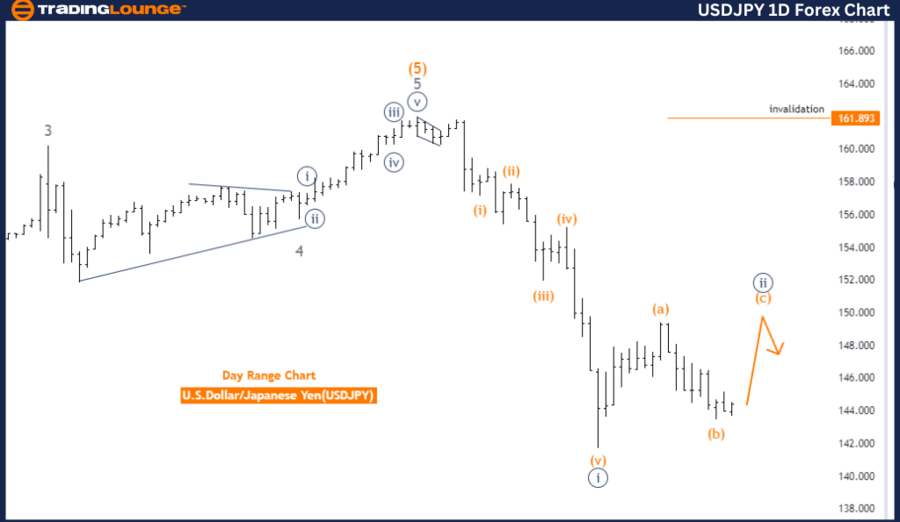
The USDJPY daily chart analysis, based on Elliott Wave theory, suggests the pair is in a counter-trend phase. This movement is identified as corrective, meaning it is a temporary reversal or consolidation within a broader trend. The primary structure being observed is navy blue wave 2, indicating the market is in the second wave of a larger corrective sequence.
The analysis highlights that navy blue wave 1 seems to have completed, and the pair is now forming navy blue wave 2. Typically, wave 2 involves a corrective move that retraces a portion of the previous impulsive wave, in this case, wave 1. The completion of wave 1 and the current formation of wave 2 suggest the market is in a consolidation or correction phase before potentially resuming the broader trend.
The direction for the next lower degrees suggests that after navy blue wave 2 completes, the market may proceed to develop navy blue wave 3. In Elliott Wave theory, wave 3 is typically the most powerful and extended wave in a trend, indicating that after the corrective wave 2 concludes, the market could see significant movement in the direction of the primary trend.
A crucial level to monitor is 161.893, identified as the wave cancel invalid level. If the price reaches or exceeds this level, it would invalidate the current Elliott Wave structure, suggesting a potential shift in market dynamics and possibly leading to the formation of a new wave pattern.
In summary, the USDJPY pair is currently in a corrective phase on the daily chart, forming navy blue wave 2 after the completion of navy blue wave 1. The key level to watch for potential invalidation of this wave structure is 161.893.
USD/JPY day chart
USD/JPY Elliott Wave technical analysis
-
Function: Counter Trend.
-
Mode: Impulsive as C.
-
Structure: Orange wave C.
-
Position: Navy blue wave 2.
-
Direction next lower degrees: Navy blue wave 3.
-
Details: Orange wave B of C appears complete, and orange wave C of 2 is currently in progress.
-
Wave cancel invalid level: 161.893.
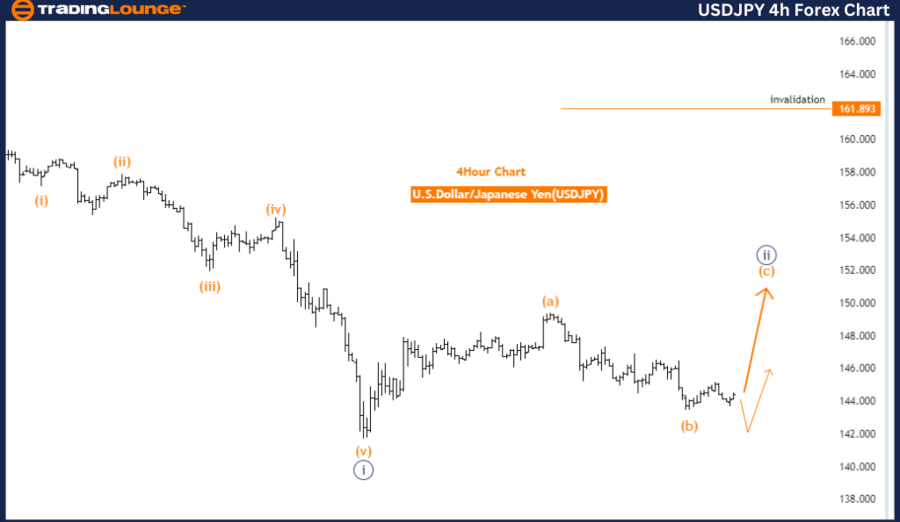
The USDJPY 4-hour chart analysis, based on Elliott Wave theory, suggests that the pair is currently experiencing a counter-trend movement. This indicates that the price action is moving against the prevailing trend, likely as part of a corrective phase. The analysis identifies that the market is in an impulsive mode within orange wave C, which is part of a larger corrective structure.
The market's position is in navy blue wave 2, indicating that the pair is in the second wave of a larger cycle, typically where corrections occur. The analysis suggests that orange wave B of C has completed, and the market has now entered orange wave C of navy blue wave 2. This ongoing corrective phase implies that the price may continue to move within this structure before potentially resuming the broader trend.
The direction for the next lower degrees points to the development of navy blue wave 3 after the completion of the current wave C. This suggests that once the corrective phase concludes, the pair might resume its impulsive movement in line with the larger trend.
A critical level to watch is 161.893, identified as the wave cancel invalid level. This level is crucial because if the price reaches or exceeds it, the current Elliott Wave structure could be invalidated. This would indicate a potential shift in market dynamics, possibly leading to a different wave pattern or trend direction.
In summary, the USDJPY pair is currently in a counter-trend phase on the 4-hour chart, positioned in navy blue wave 2. The completion of orange wave B of C has led to the development of orange wave C, which is currently in play. The key level to monitor for potential invalidation of this wave structure is 161.893.
USD/JPY Elliott Wave technical analysis [Video]
Author

Peter Mathers
TradingLounge
Peter Mathers started actively trading in 1982. He began his career at Hoei and Shoin, a Japanese futures trading company.


