USD/JPY Elliott Wave technical analysis [Video]
![USD/JPY Elliott Wave technical analysis [Video]](https://editorial.fxstreet.com/images/Markets/Currencies/Majors/USDJPY/japanese-yen-62890274_XtraLarge.jpg)
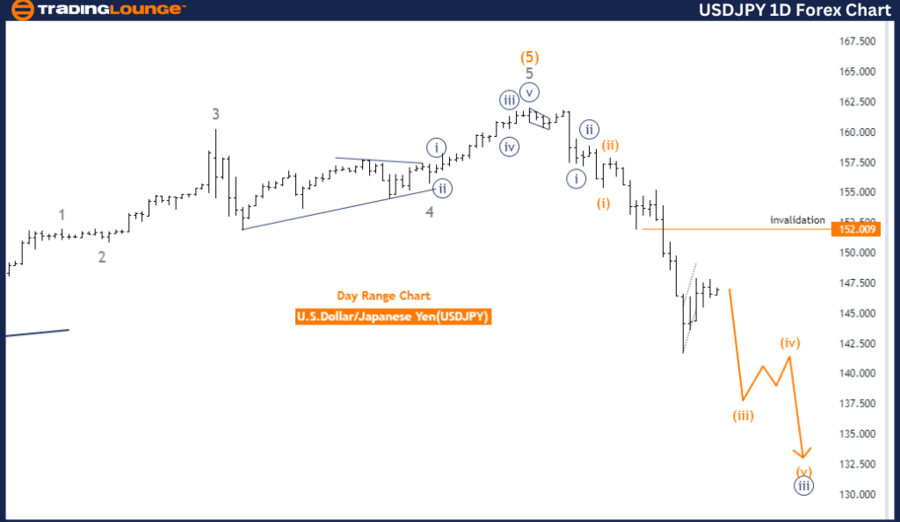
USD/JPY Elliott Wave Analysis Trading Lounge Day Chart.
U.S. Dollar/Japanese Yen (USD/JPY) Day Chart.
USD/JPY Elliott Wave technical analysis
Function: Trend.
Mode: Impulsive.
Structure: Orange Wave 3.
Position: Navy Blue Wave 3.
Direction next higher degrees: Orange Wave 4.
Details: Orange wave 2 appears completed, now orange wave 3 is active.
Wave cancel invalid level: 152.009.
The USD/JPY Elliott Wave Analysis on the daily chart shows a pronounced trend, defined by an impulsive mode with orange wave 3 as the primary structure. This suggests the market is currently undergoing a significant upward movement within the Elliott Wave framework.
The market is positioned within navy blue wave 3, part of the broader orange wave 3. This indicates a strong and sustained upward trend is in progress. According to Elliott Wave theory, wave 3 is generally the most powerful and longest wave in an impulsive sequence, implying that the current trend is likely to continue with considerable momentum.
The direction for the next higher degrees points toward the upcoming orange wave 4. This indicates that after the completion of the current orange wave 3, the market may enter a corrective phase, leading into orange wave 4. For now, the focus remains on the continuation of the upward trend within orange wave 3.
The analysis notes that orange wave 2 has been completed. This marks the end of a corrective phase and the start of the next impulsive wave, orange wave 3. The transition from orange wave 2 to orange wave 3 is crucial, as it signals the beginning of a new, stronger phase in the market's upward movement.
The wave cancel invalid level is identified at 152.009. This level is critical for confirming the current wave structure. If the market falls below this level, it would invalidate the current analysis, suggesting the anticipated upward movement within orange wave 3 is not materializing as expected. In such a case, reevaluating the wave count and overall market direction would be necessary.
Summary:
The USD/JPY Elliott Wave Analysis on the daily chart indicates a strong upward trend within an impulsive wave structure. The market is currently advancing in navy blue wave 3 within orange wave 3, following the completion of orange wave 2. The wave cancel invalid level at 152.009 is key to maintaining this bullish outlook.
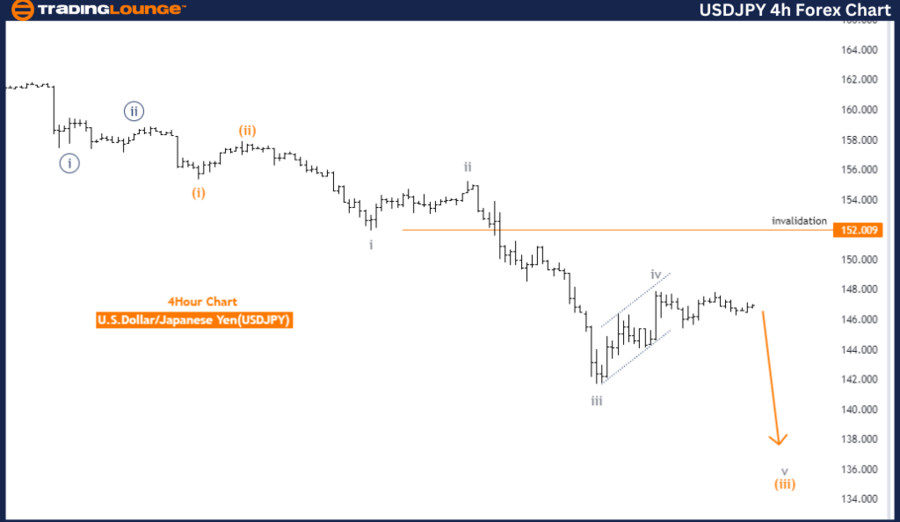
U.S. Dollar / Japanese Yen (USD/JPY) 4 Hour Chart.
USD/JPY Elliott Wave technical analysis
Function: Trend.
Mode: Impulsive.
Structure: Gray Wave 5.
Position: Orange Wave 3.
Direction next higher degrees: Orange Wave 4.
Details: Gray wave 4 appears completed; now gray wave 5 is active.
Wave cancel invalid level: 152.009.
The USD/JPY Elliott Wave Analysis on the 4-hour chart indicates a strong trend characterized by an impulsive mode. The primary wave structure under analysis is gray wave 5, suggesting the market is in the final stage of a larger upward movement within the Elliott Wave framework.
Currently, the market is positioned within orange wave 3. This placement emphasizes that the market is advancing in the third wave of the larger gray wave 5, which is typically the most powerful and extended wave in an impulsive structure. The direction for the next higher degrees points toward the upcoming orange wave 4, indicating that after the completion of the current wave, a corrective phase may begin.
The analysis details that gray wave 4 seems to have been completed. This marks the end of a corrective phase within the ongoing upward trend and sets the stage for the development of gray wave 5. The progression into gray wave 5 is significant as it represents the final push of the current trend, with the market expected to maintain its upward momentum until this wave concludes.
The wave cancel invalid level is identified at 152.009. This level is crucial for confirming the current wave structure. If the market drops below this level, it would invalidate the present analysis, suggesting that the anticipated upward movement within gray wave 5 is not unfolding as expected. In such a case, a reassessment of the wave count and overall market direction would be necessary.
Summary:
The USD/JPY Elliott Wave Analysis on the 4-hour chart indicates a continued upward trend within an impulsive wave structure. The market is currently advancing in orange wave 3 within gray wave 5, following the completion of gray wave 4. The wave cancel invalid level at 152.009 is key to maintaining the validity of this bullish outlook.
Technical analyst: Malik Awais.
USD/JPY Elliott Wave technical analysis [Video]
Author

Peter Mathers
TradingLounge
Peter Mathers started actively trading in 1982. He began his career at Hoei and Shoin, a Japanese futures trading company.


