USD/JPY Elliott Wave technical analysis [Video]
![USD/JPY Elliott Wave technical analysis [Video]](https://editorial.fxstreet.com/images/Markets/Currencies/Majors/USDJPY/japanese-yen1_XtraLarge.jpg)
USD/JPY Elliott Wave technical analysis
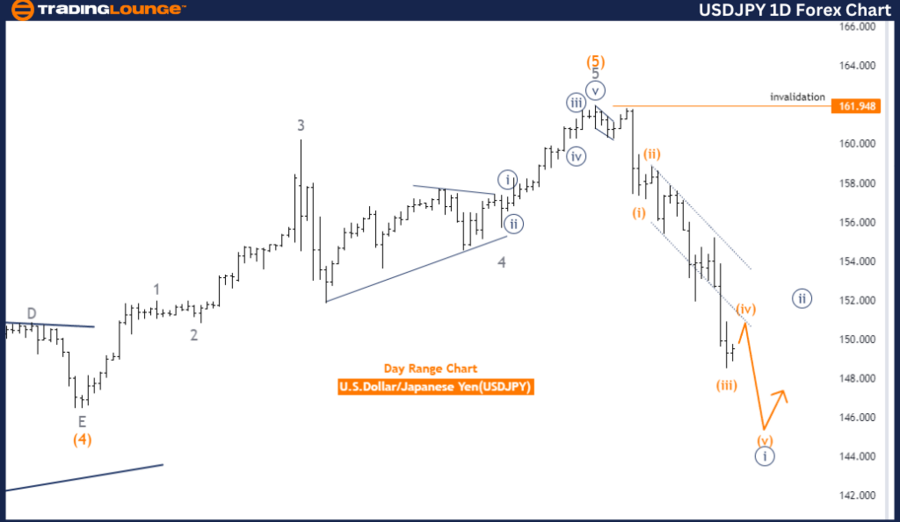
Function: Trend.
Mode: Impulsive.
Structure: Navy blue wave 1.
Position: Gray wave 1.
Direction next higher degrees: Navy blue wave 2.
Details: Navy blue wave 1 of gray wave 1 is in play. Wave cancel invalid level: 161.948.
The USD/JPY Elliott Wave Analysis on the day chart shows a trend function with an impulsive mode. The current wave structure is identified as navy blue wave 1, which is part of the larger gray wave 1. This suggests that the market is in the early stages of a new upward trend, with navy blue wave 1 representing the initial phase of this impulsive movement.
The position within the wave structure is currently at gray wave 1. This indicates that the market is in the first wave of a larger degree trend, implying that further impulsive waves are expected to follow as the trend progresses. The direction for the next higher degrees is identified as navy blue wave 2. This suggests that after the completion of navy blue wave 1, a corrective phase will occur, represented by navy blue wave 2, before the market resumes its primary upward trend.
The analysis details that navy blue wave 1 of gray wave 1 is currently in play. This means the market is in the initial impulsive phase of the larger trend, indicating strong upward momentum. As the first wave of a new trend, navy blue wave 1 typically sets the stage for subsequent waves that will continue to build on this initial movement.
The wave cancel invalid level is set at 161.948. This level is crucial for validating the current wave structure. If the USD/JPY moves below this threshold, the existing wave count would be invalidated. This invalidation would necessitate a reassessment of the wave count and the overall market outlook, suggesting that the anticipated wave pattern is no longer applicable.
In summary, the USD/JPY Elliott Wave Analysis on the day chart indicates that the market is in an impulsive phase within navy blue wave 1, positioned in gray wave 1. The current phase is characterized by strong upward momentum, with a corrective phase expected to follow, represented by navy blue wave 2. The wave cancel invalid level of 161.948 is critical for validating the current wave structure, and any breach of this level would require a reassessment of the wave count.
USD/JPY day chart
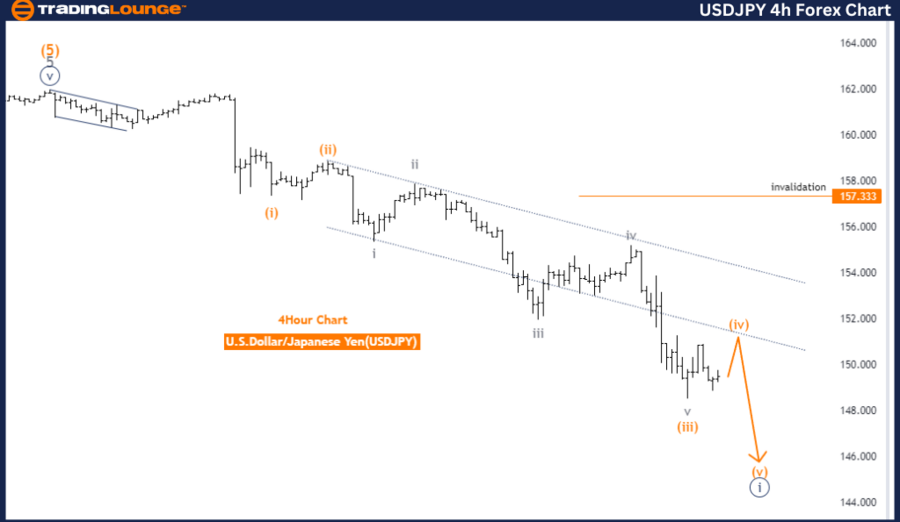
USD/JPY four-hour chart
Function: Counter Trend.
Mode: Corrective.
Structure: Orange wave 4.
Position: Navy blue wave 1.
Direction next lower degrees: Orange wave 5.
Details: Orange wave 3 of 1 looking completed, now orange wave 4 is in play. Wave cancel invalid level: 157.333.
The USD/JPY Elliott Wave Analysis on the 4-hour chart indicates a counter-trend function with a corrective mode. The wave structure is currently in orange wave 4, positioned within navy blue wave 1. This suggests that the market is undergoing a temporary corrective phase before resuming its primary trend.
The analysis reveals that orange wave 3 of 1 appears to have completed. This completion marks the end of the prior impulsive phase and the beginning of the corrective phase, represented by orange wave 4. The ongoing corrective phase is expected to provide a temporary pullback or consolidation before the market resumes its primary trend direction.
The direction for the next lower degrees is identified as orange wave 5. This indicates that once the corrective phase of orange wave 4 is completed, the market is likely to transition into the next impulsive phase, represented by orange wave 5. This upcoming phase is expected to align with the broader market trend, continuing the primary movement observed in previous waves.
The wave cancel invalid level is set at 157.333. This level is crucial for validating the current wave structure. If the USD/JPY drops below this threshold, the existing wave count would be invalidated. This invalidation would necessitate a reassessment of the wave count and the overall market outlook, suggesting that the anticipated wave pattern is no longer applicable.
In summary, the USD/JPY Elliott Wave Analysis on the 4-hour chart indicates that the market is in a corrective phase within orange wave 4, positioned in navy blue wave 1. The completion of orange wave 3 marks the transition to this corrective phase, which is expected to precede the next impulsive phase represented by orange wave 5. The wave cancel invalid level of 157.333 is critical for validating the current wave structure, and any breach of this level would require a reassessment of the wave count.
USD/JPY Elliott Wave technical analysis [Video]
Author

Peter Mathers
TradingLounge
Peter Mathers started actively trading in 1982. He began his career at Hoei and Shoin, a Japanese futures trading company.


