EUR/USD:
Weekly timeframe:
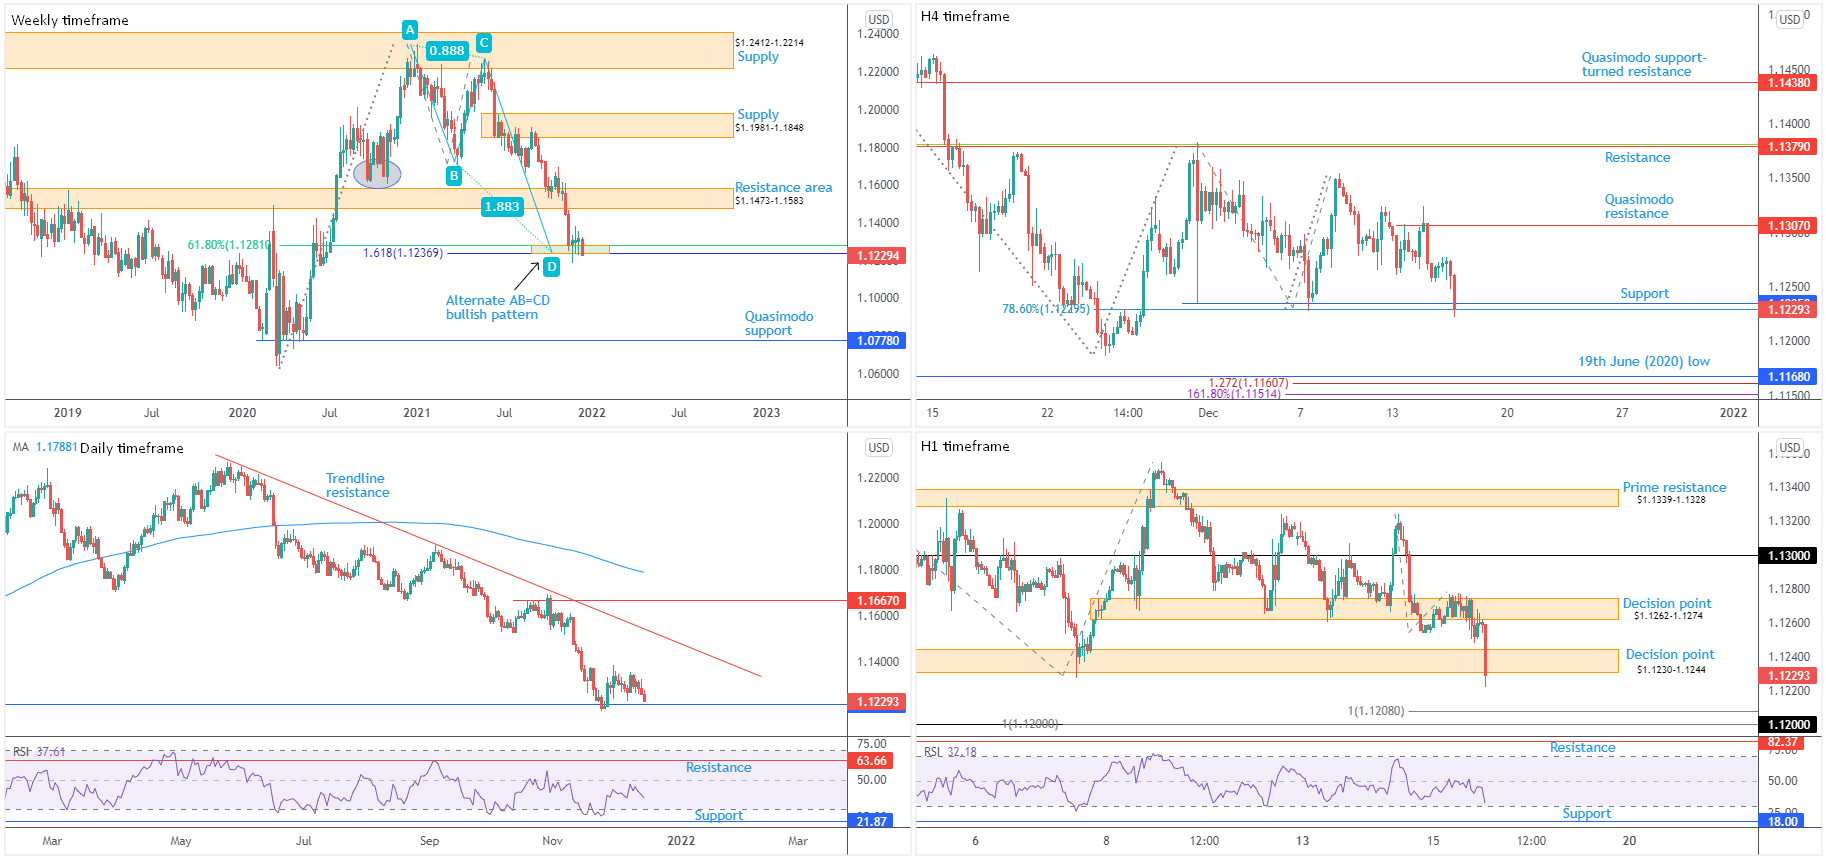
Since mid-November, buyers and sellers have been squaring off around support at $1.1237-1.1281—made up of a 61.8% Fibonacci retracement at $1.1281 and a 1.618% Fibonacci projection from $1.1237.
‘Harmonic’ traders will acknowledge $1.1237 represents what’s known as an ‘alternate’ AB=CD formation.
Any upside derived from current support will likely be capped by resistance at $1.1473-1.1583; navigating lower, on the other hand, throws light on Quasimodo support as far south as $1.0778.
Interestingly, the pair took out 2nd November low (2020) at $1.1603 in late September. This suggests the beginnings of a primary downtrend on the weekly timeframe, reinforced by the monthly timeframe trending lower since mid-2008.
Daily timeframe:
Quasimodo support drawn from mid-June at $1.1213 (positioned beneath the weekly timeframe’s Fibonacci structure) made an entrance on 24th November and remains committed for the time being. A run higher, movement beyond $1.1354ish, casts light on trendline resistance, extended from the high $1.2254. Establishing a decisive close beneath $1.1213, however, exposes support on the daily timeframe at $1.0991 (not visible on the screen).
Regarding the relative strength index (RSI), the value recently recovered, though has failed to reach the 50.00 centreline. This suggests subdued interest to the upside.
H4 timeframe:
Support at $1.1235 put in an appearance on Wednesday and, aided by a 78.6% Fibonacci retracement at $1.1230. Quasimodo resistance calls for attention higher up at $1.1307, with subsequent buying perhaps taking aim at resistance drawn from $1.1379.
Downstream, 19th June (2020) low is seen as the next reasonable support target, accompanied by a 1.272% Fibonacci projection at $1.1161 and a 1.618% Fibonacci extension at $1.1151.
H1 timeframe:
As anticipated, Europe’s single currency sailed below the $1.1262-1.1274 decision point on Wednesday, unlocking the trapdoor to the $1.1230-1.1244 decision point. Having seen recent hours spike the lower edge of the aforesaid zone, the $1.12 region is likely to be on the radar for many technicians, which happens to draw in two 100% Fibonacci projections at $1.1200 and $1.1208.
The picture derived from the relative strength index (RSI) reveals oversold conditions are likely upon us, with support in range at 18.00.
Observed Technical Levels:
The $1.1230-1.1244 decision point giving way on the H1 timeframe potentially sets the short-term technical stage for an approach to $1.12 (and associated Fibonacci structure: $1.1200-1.1208).
AUD/USD:
Weekly timeframe:
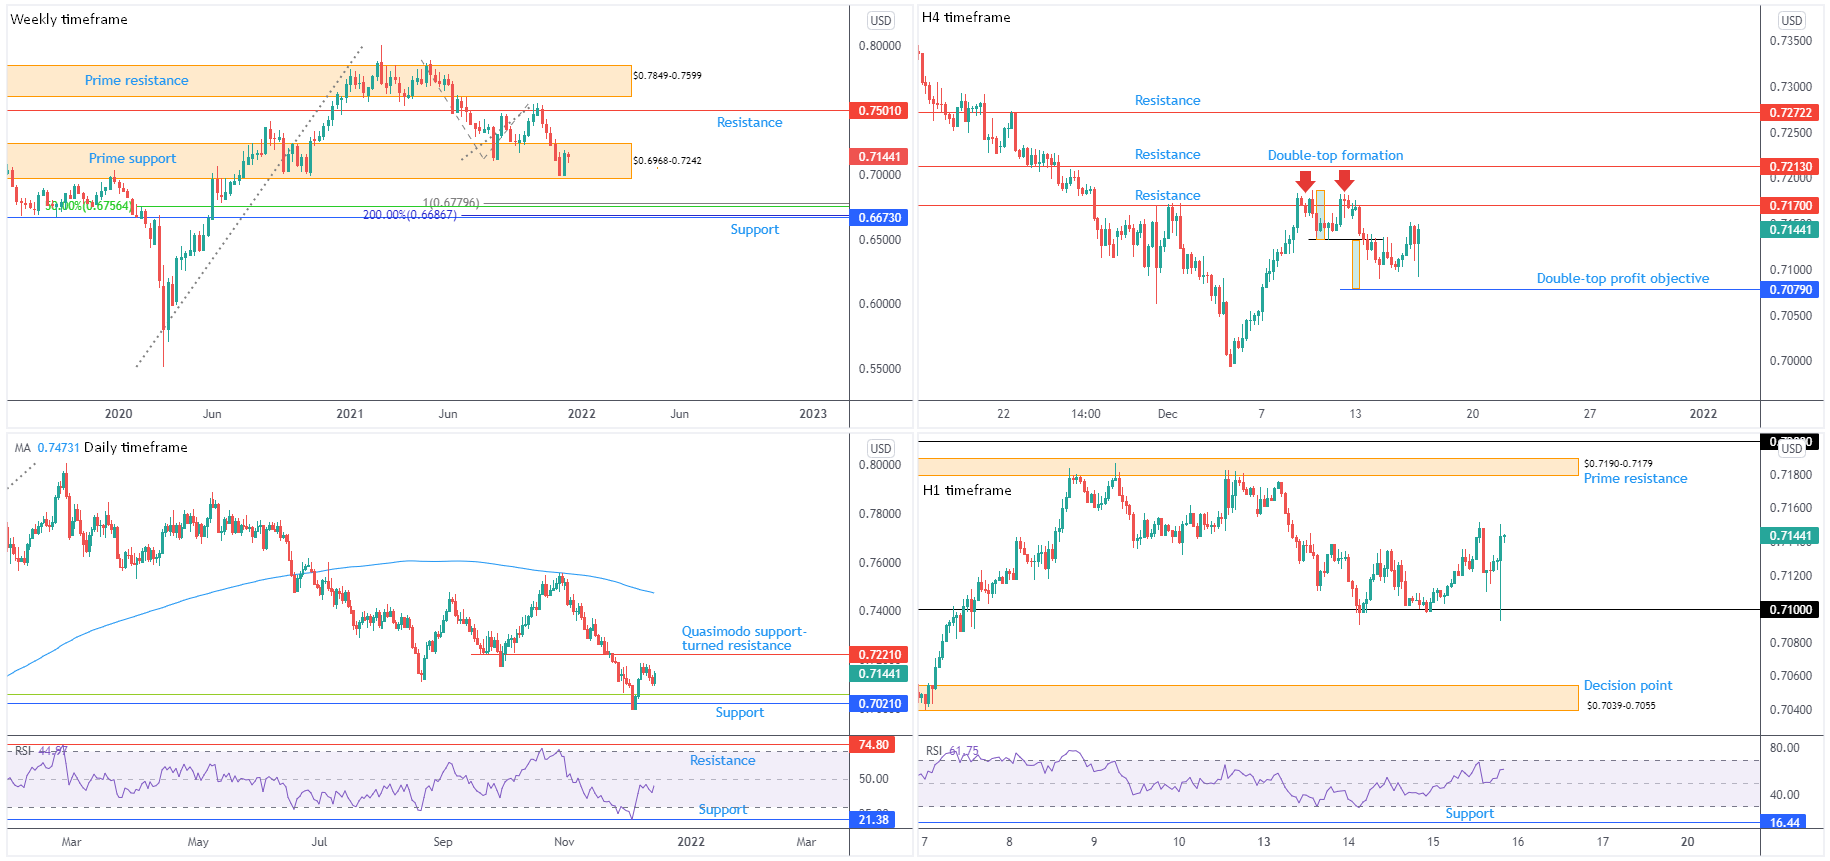
Bulls embraced an offensive phase last week from deep within prime support at $0.6968-0.7242. Not only did the move snap a five-week losing streak, it emphasised interest remains within the support and could see action take aim at resistance from $0.7501.
Manoeuvring beneath $0.6968-0.7242, nevertheless, reveals support at $0.6673 and a gathering of Fibonacci ratios between $0.6687 and $0.6780. Included within this area is a 100% Fibonacci projection: an AB=CD bullish formation.
Trend on the weekly timeframe has been higher since pandemic lows of $0.5506 (March 2020); however, the monthly timeframe has been entrenched within a large-scale downtrend since mid-2011.
Daily timeframe:
Support at $0.7021 put in an appearance early last week, bolstered by a 38.2% Fibonacci retracement at $0.7057 (green). Despite effort to maintain a bullish setting, the currency pair is struggling to reach Quasimodo support-turned resistance at $0.7221.
The trend on the daily timeframe has maintained a downside trajectory since late February. Momentum studies also show the relative strength index (RSI) trading from space under the 50.00 centreline, which demonstrates lacklustre upside momentum on this timeframe.
H4 timeframe:
While AUD/USD bulls demonstrated some willingness to hold ground on Wednesday, the technical landscape remains directed towards the double-top pattern’s ($0.7183) profit objective at $0.7079.
In the event buyers remain the dominant force, resistance is visible at $0.7170, closely shadowed by another layer of resistance at $0.7213.
H1 timeframe:
Short-term movement printed a spirited rebound from $0.71 in recent hours, a move highlighting prime resistance at $0.7190-0.7179 and $0.72. Territory beneath $0.71 shifts attention to a decision point from $0.7039-0.7055.
The relative strength index (RSI) has the value respecting the upper edge of the 50.00 centreline, emphasising support and positive momentum until overbought status is reached, or the 50.00 centreline gives in.
Observed Technical Levels:
While the possibility of dropping to test the H4 timeframe’s double-top pattern’s ($0.7183) profit objective at $0.7079 remains, H1 traders will also likely be watching for a run to prime resistance at $0.7190-0.7179.
USD/JPY:
Weekly timeframe:
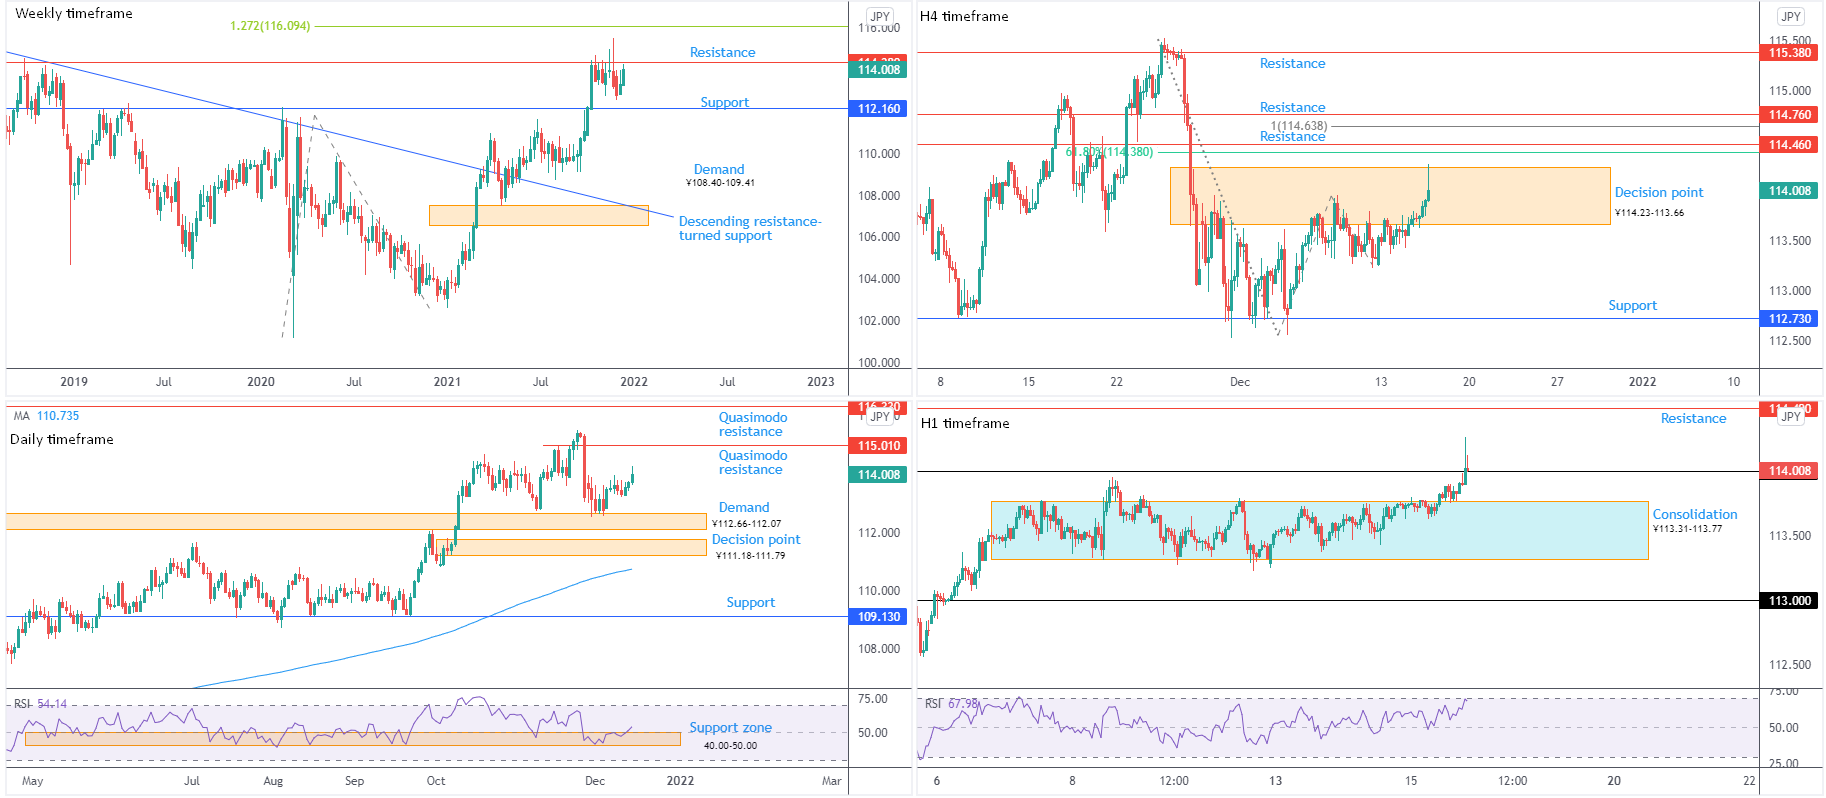
Since the beginning of October, the USD/JPY crossed swords with resistance from ¥114.38 and put in a 4-year pinnacle at ¥115.52.
Above current resistance is a 1.272% Fibonacci projection from ¥116.09, while directly below has support in view at ¥112.16.
In terms of trend, the unit has been advancing since the beginning of this year.
Daily timeframe:
Buyers are beginning to make some headway, following the recovery from supply-turned demand at ¥112.66-112.07. Quasimodo resistance at ¥115.01 is overhead, with a break directing flow to another Quasimodo resistance plotted at ¥116.33.
RSI (relative strength index) analysis shows the value rebounding from support between 40.00 and 50.00 (indicator support often forms around the 50.00 area amid prolonged uptrends and operates as a ‘temporary’ oversold base).
H4 timeframe:
Latest developments out of the H4 scale observed the candles venture into a decision point from ¥114.23-113.66 and clip its upper edge (likely tripping a portion of buy-stops).
Resistance is at ¥114.46 and ¥114.76. Also of technical relevance is the 100% Fibonacci projection at ¥114.64, an AB=CD structure located nearby a 61.8% Fibonacci retracement at ¥114.38.
H1 timeframe:
Following a week-long consolidation between ¥113.31 and ¥113.77, the unit voyaged above ¥114 to a high of ¥114.26. Assuming the currency pair finds acceptance north of the round number, resistance could move into position at ¥114.49.
The relative strength index (RSI) is within striking distance of overbought territory.
Observed Technical Levels:
In the event H1 price defends the upper side of ¥114, continuation buying could emerge towards weekly resistance at ¥114.38, followed by H4 and H1 resistances at ¥114.46 and ¥114.49, respectively.
GBP/USD:
Weekly timeframe:
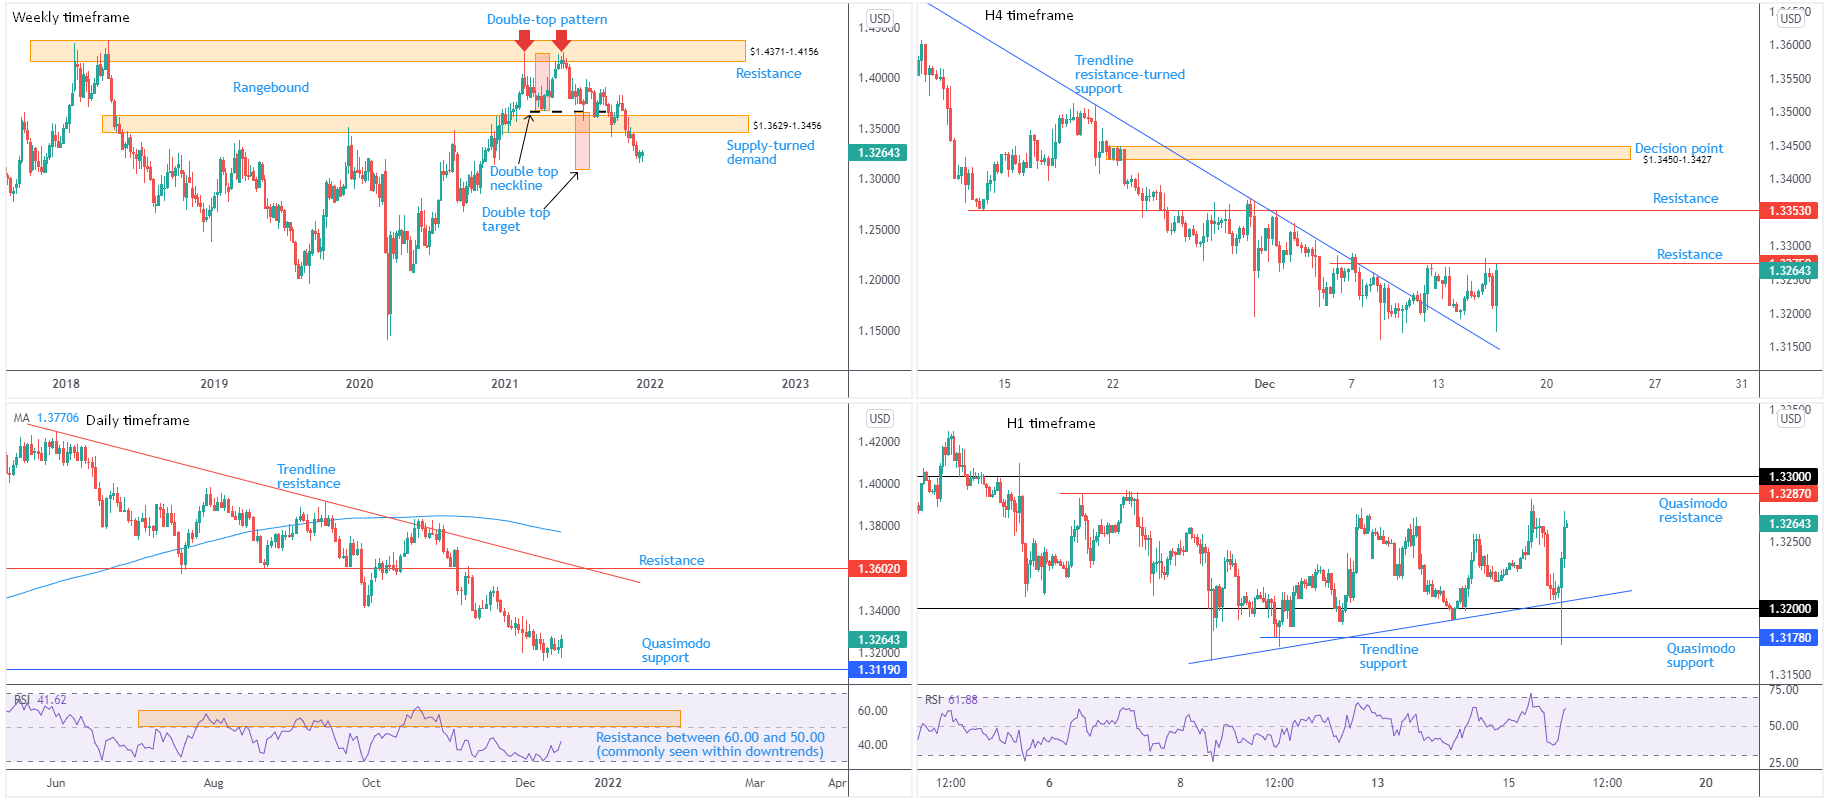
Supply-turned demand at $1.3629-1.3456 recently surrendered position.
Couple this with price closing under a double-top pattern’s ($1.4241) neckline at $1.3669 in August, and the monthly timeframe trading lower since late December 2007, the weekly chart reflects a bearish technical outlook. The double-top pattern’s profit objective—measured by taking the distance between the highest peak to the neckline and extending this value lower from the breakout point—delivers a downside target around $1.3093.
Daily timeframe:
Despite a bullish showing Wednesday, the technical landscape on the daily timeframe remains unchanged.
Quasimodo support at $1.3119 is firmly in the headlights on this timeframe.
Resistance remains at $1.3602, plotted nearby trendline resistance, taken from the high $1.4250—both forming clear upside objectives should buyers regain consciousness.
Longer-term sentiment has remained biased to the downside since June. This has caused the relative strength index (RSI) to form indicator resistance between 60.00 and 50.00 (common in downtrends). Note, however, the indicator recently rebounded from oversold space and is attempting to find a reception above 40.00.
H4 timeframe:
Trendline resistance, extended from the high $1.3815, was taken out in recent candles with price coming within striking distance of retesting the latter as support. The break of trendline resistance, as underlined in previous writing, and a decisive break of resistance from $1.3275, shines light on a possible run back to resistance at $1.3353.
H1 timeframe:
Trendline support, taken from the low $1.3160, and $1.32 psychological support, served well on Wednesday, aided by a neighbouring Quasimodo support level from $1.3178. Price jumped from the aforementioned levels, consequently drawing attention to Quasimodo resistance at $1.3287 and $1.33.
The relative strength index (RSI) reclaimed 50.00+ position from a low of 37.18. As a result, the indicator suggests positive momentum.
Observed Technical Levels:
Between $1.33 on the H1 and H4 resistance at $1.3275 is an area the charts may witness sellers make an entrance. This is in line with higher timeframe direction: weekly chart displaying scope to approach $1.3100ish and the daily timeframe towards $1.3119.
This material on this website is intended for illustrative purposes and general information only. It does not constitute financial advice nor does it take into account your investment objectives, financial situation or particular needs. Commission, interest, platform fees, dividends, variation margin and other fees and charges may apply to financial products or services available from FP Markets. The information in this website has been prepared without taking into account your personal objectives, financial situation or needs. You should consider the information in light of your objectives, financial situation and needs before making any decision about whether to acquire or dispose of any financial product. Contracts for Difference (CFDs) are derivatives and can be risky; losses can exceed your initial payment and you must be able to meet all margin calls as soon as they are made. When trading CFDs you do not own or have any rights to the CFDs underlying assets.
FP Markets recommends that you seek independent advice from an appropriately qualified person before deciding to invest in or dispose of a derivative. A Product Disclosure Statement for each of the financial products is available from FP Markets can be obtained either from this website or on request from our offices and should be considered before entering into transactions with us. First Prudential Markets Pty Ltd (ABN 16 112 600 281, AFS Licence No. 286354).
Recommended Content
Editors’ Picks
GBP/USD remains heavy below 1.2300 amid UK bond market sell-off
GBP/USD consoldiates near 14-month lows below 1.2300 in European trading on Thursday. The pair bears the brunt of the UK bond market sell-off, with the 10-year Gilt yields at the highest since August 2008. Extended US Dollar strength and a bearish daily technical setup exaerbate its pain.

EUR/USD stays depressed near 1.0300 after Eurozone Retail Sales data
EUR/USD remains on the back foot at around 1.0300 in the European session on Thursday. German Industrial Production and Eurozone Retail Sales data for November fail to lift the Euro amid a sustained US Dollar demand. Fedspeak is next in focus.

Gold price moves back closer to multi-week top; modest USD strength might cap gains
Gold price turns positive for the third straight day and draws support from a combination of factors. Geopolitical risks, trade war fears and retreating US bond yields lend support to the XAU/USD pair.

BNB poised for a decline on negative Funding Rate
BNB price hovers around $696.40 on Thursday after declining 4.58% in the previous two days. BNB’s momentum indicators hint for a further decline as its Relative Strength Index and Moving Average Convergence Divergence show bearish signals.

Bitcoin edges below $96,000, wiping over leveraged traders
Bitcoin's price continues to edge lower, trading below the $96,000 level on Wednesday after declining more than 5% the previous day. The recent price decline has triggered a wave of liquidations across the crypto market, resulting in $694.11 million in total liquidations in the last 24 hours.

Best Forex Brokers with Low Spreads
VERIFIED Low spreads are crucial for reducing trading costs. Explore top Forex brokers offering competitive spreads and high leverage. Compare options for EUR/USD, GBP/USD, USD/JPY, and Gold.
