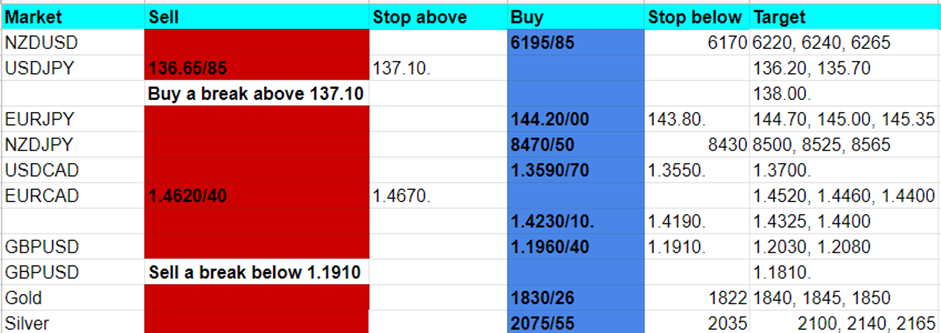
USD/JPY: A break higher 137.10 is a buy signal

AUDUSD made a high for the day at resistance at 6760/70 yesterday & again today, shorts need stops above 6800.
Shorts did target 6730/25 with minor support at this week's low at 6700/6690. A break below 6690 is a sell signal targeting 6665/60, perhaps as far as 6630/20.
NZDUSD a low for the day just 2 pips above my buying opportunity at 6195/85. Longs need stops below 6170. Targets are 6220, 6240 & 6265.
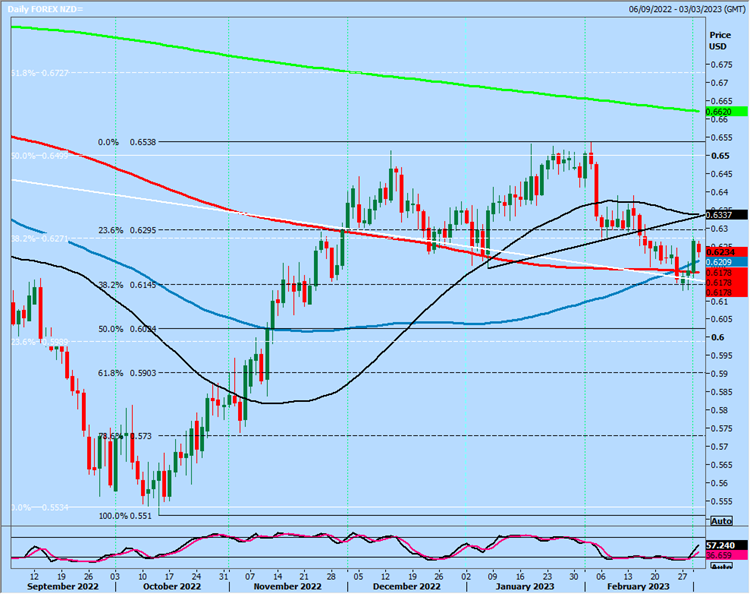
A break lower however can target 6145/35.
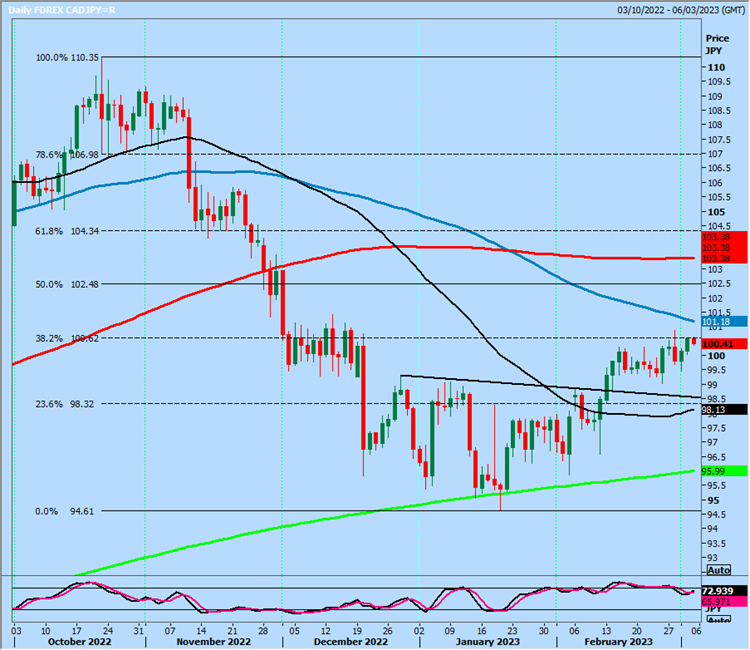
CADJPY longs at 9970 worked perfectly on the bounce to my targets of 100.40 & 100.60 for profit taking. That'll do for this week.
USDJPY tests strong resistance at 136.65/85 & held here yesterday. Again we need stops above 137.10. A break higher is a buy signal for this week targeting 138.00/20.
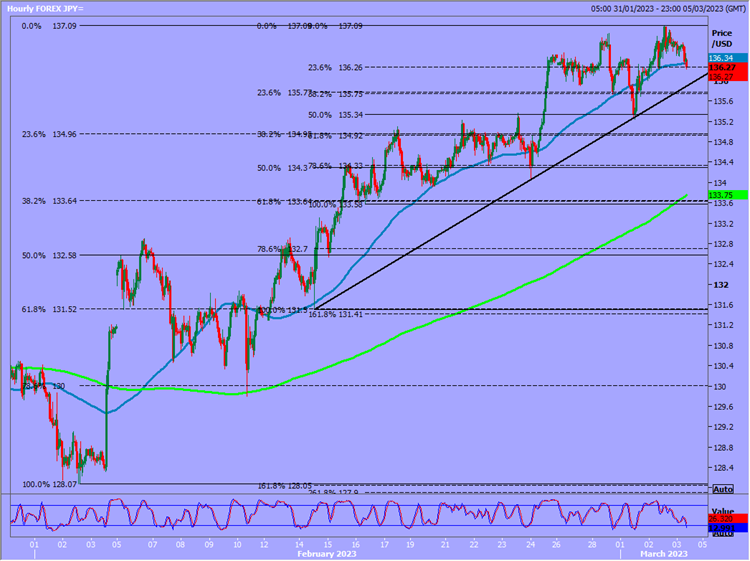
Targets for shorts are 136.20/10 & 135.70/60.
EURJPY very volatile & unpredictable. Today we should have strong support at 144.20/00 if we reverse again. Longs need stops below 143.80.
Targets are 144.70 & 145.00, perhaps as far as this week's high at 145.35/45. A break above 145.50 can target 146.00/10.
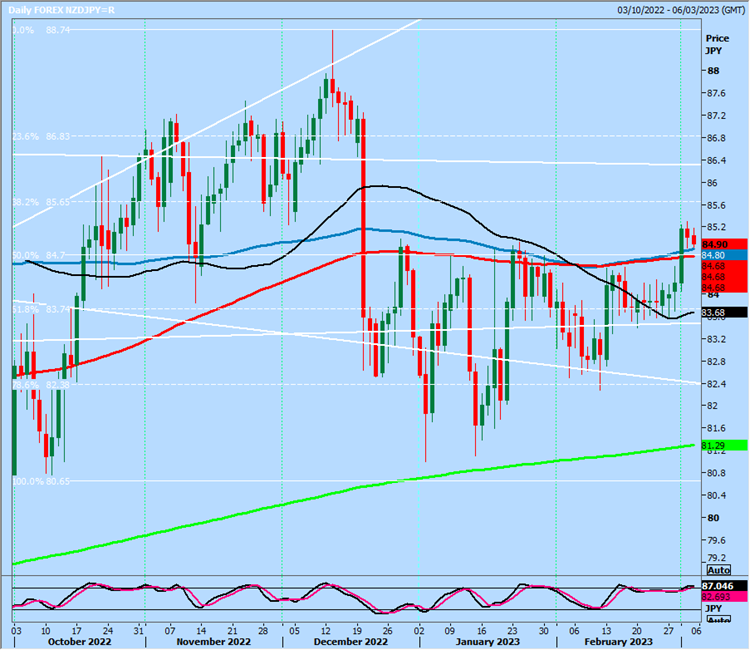
NZDJPY finally beat resistance at 8450/80 for a buy signal. So we should have a buying opportunity at 8470/50. Longs need stops below 8430.
Targets are 8500 & 8525 then 8565 & 8590.
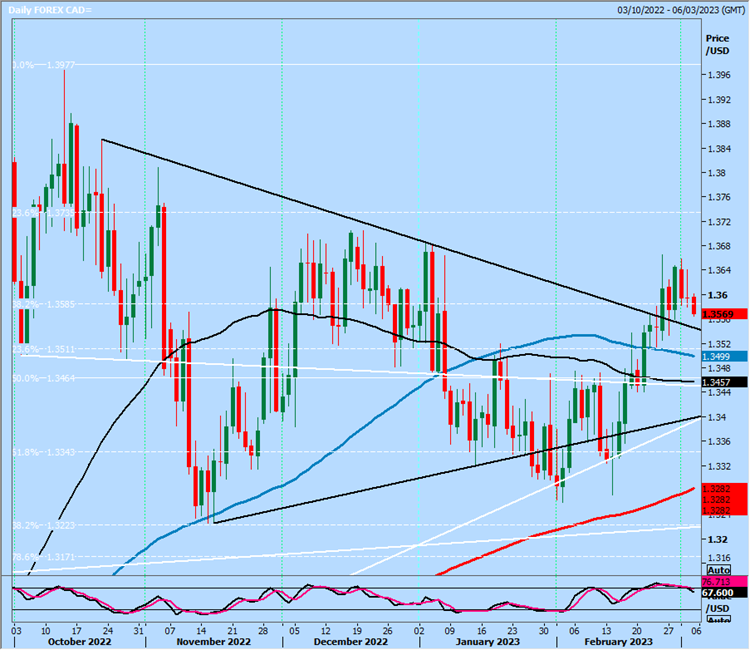
USDCAD has traded sideways holding within last Friday's range all this week. We made a low for the day exactly at 1.3590/70 yesterday again yesterday to maintain a buy signal targeting 1.3700.
Longs at 1.3590/70 if we retest today, stop below 1.3550.
Dollar Index up one day, down the next day in the 1 week sideways trend. Still holding strong support at 104.30/20 & saw a nice 100 pip bounce. If the support is retested, longs need stops below 104.00.
A break lower targets strong support at 103.70/50.
A break above 104.80 is more positive for today. Obviously bulls need a break above this week's high at 105.32 for the next buy signal.
EURCAD is establishing a sideways trend from support at 1.4230/10 up to resistance at the January high at 1.4620/40.
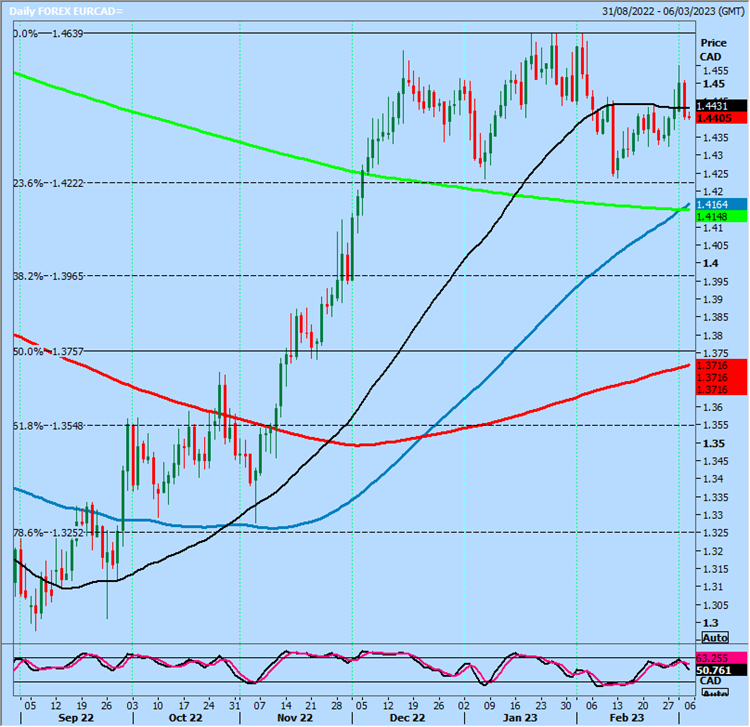
All we can do is try to trade this range while we wait for a breakout.
GBPUSD made a high for the day just 2 pips from my resistance at 1.2090/1.2110 on Wednesday & collapsed to strong support at 1.1960/40 yesterday.
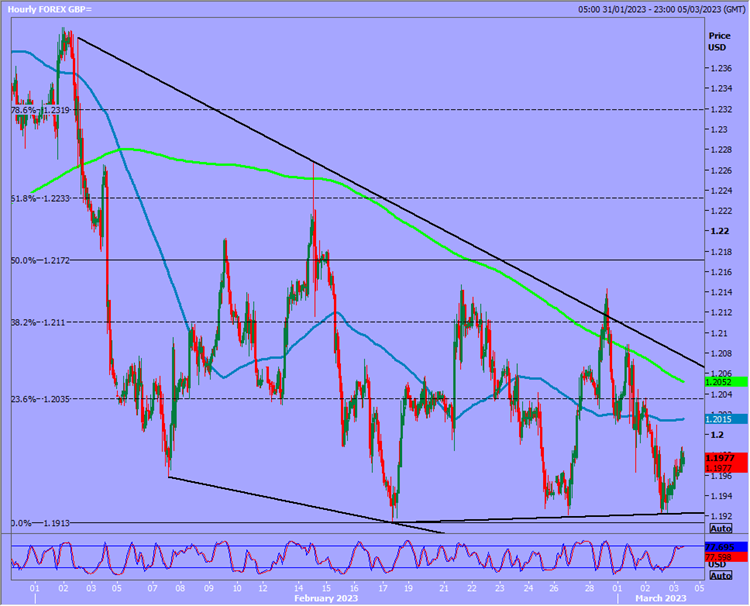
So this level remains key to direction on the downside. A bounce from here can target 1.2030/40, perhaps as far as 1.2070/1.2090 for profit taking on longs.
Bulls need a break above the 2 week high at 1.2140/47 for a buy signal.
Strong support again at 1.1960/40. Longs need stops below 1.1910. A break below 1.1910 is a sell signal for next week targeting 1.1865/55, perhaps as far as 1.1810/00.
Author

Jason Sen
DayTradeIdeas.co.uk


